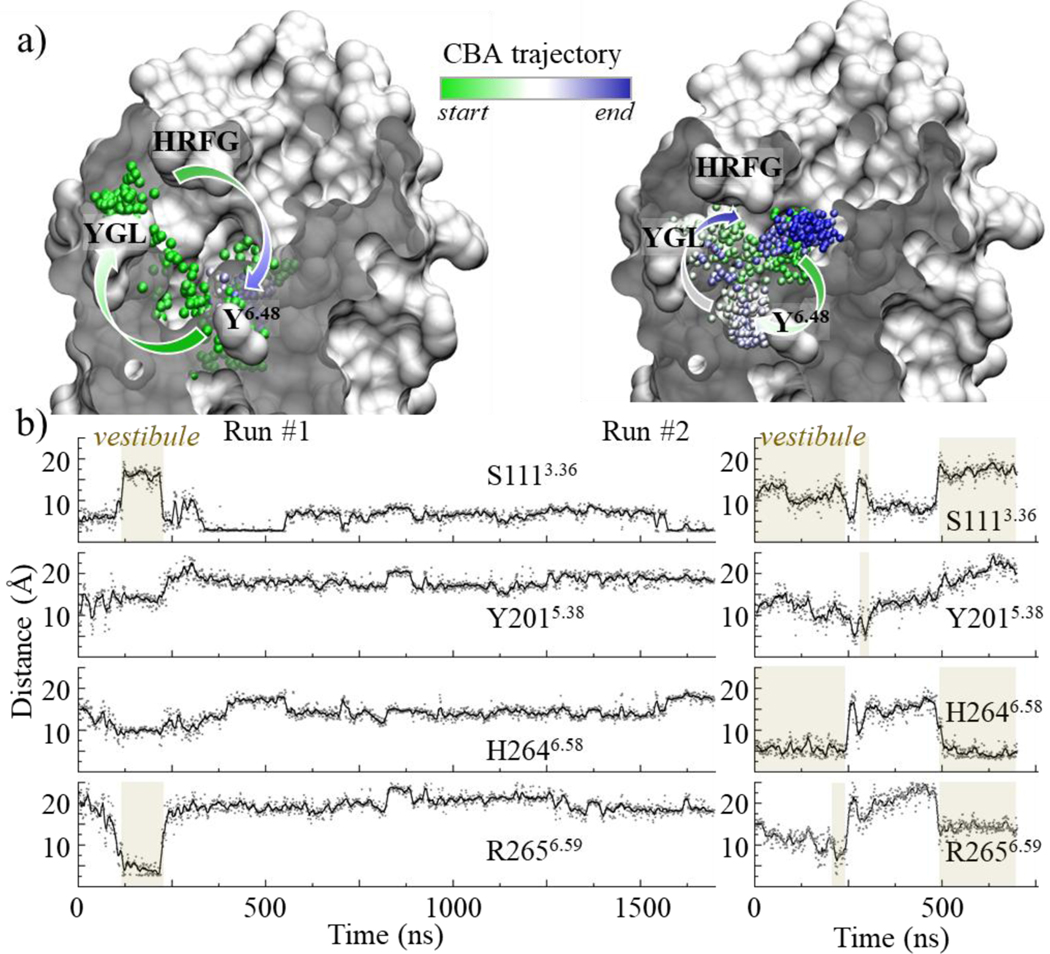
Figure 3. The vestibule is connected to the orthosteric binding cavity.
a) Locations of CBA (as shown by a sphere corresponding to its carboxylic atom) during two independent MD trajectories initiated either at the orthosteric cavity (Run #1, left) or at the vestibule (Run #2, right). Green to blue colors indicate simulation time evolution. b) Distance analysis between a CBA oxygen atom and donor/acceptor groups of S111 (bottom of the cavity), and Y201, H264, and R265 (forming the vestibule). In both simulations, CBA engages opportunistic hydrogen bonds with residues forming the vestibule. Periods during which CBA visits the vestibule are highlighted.

