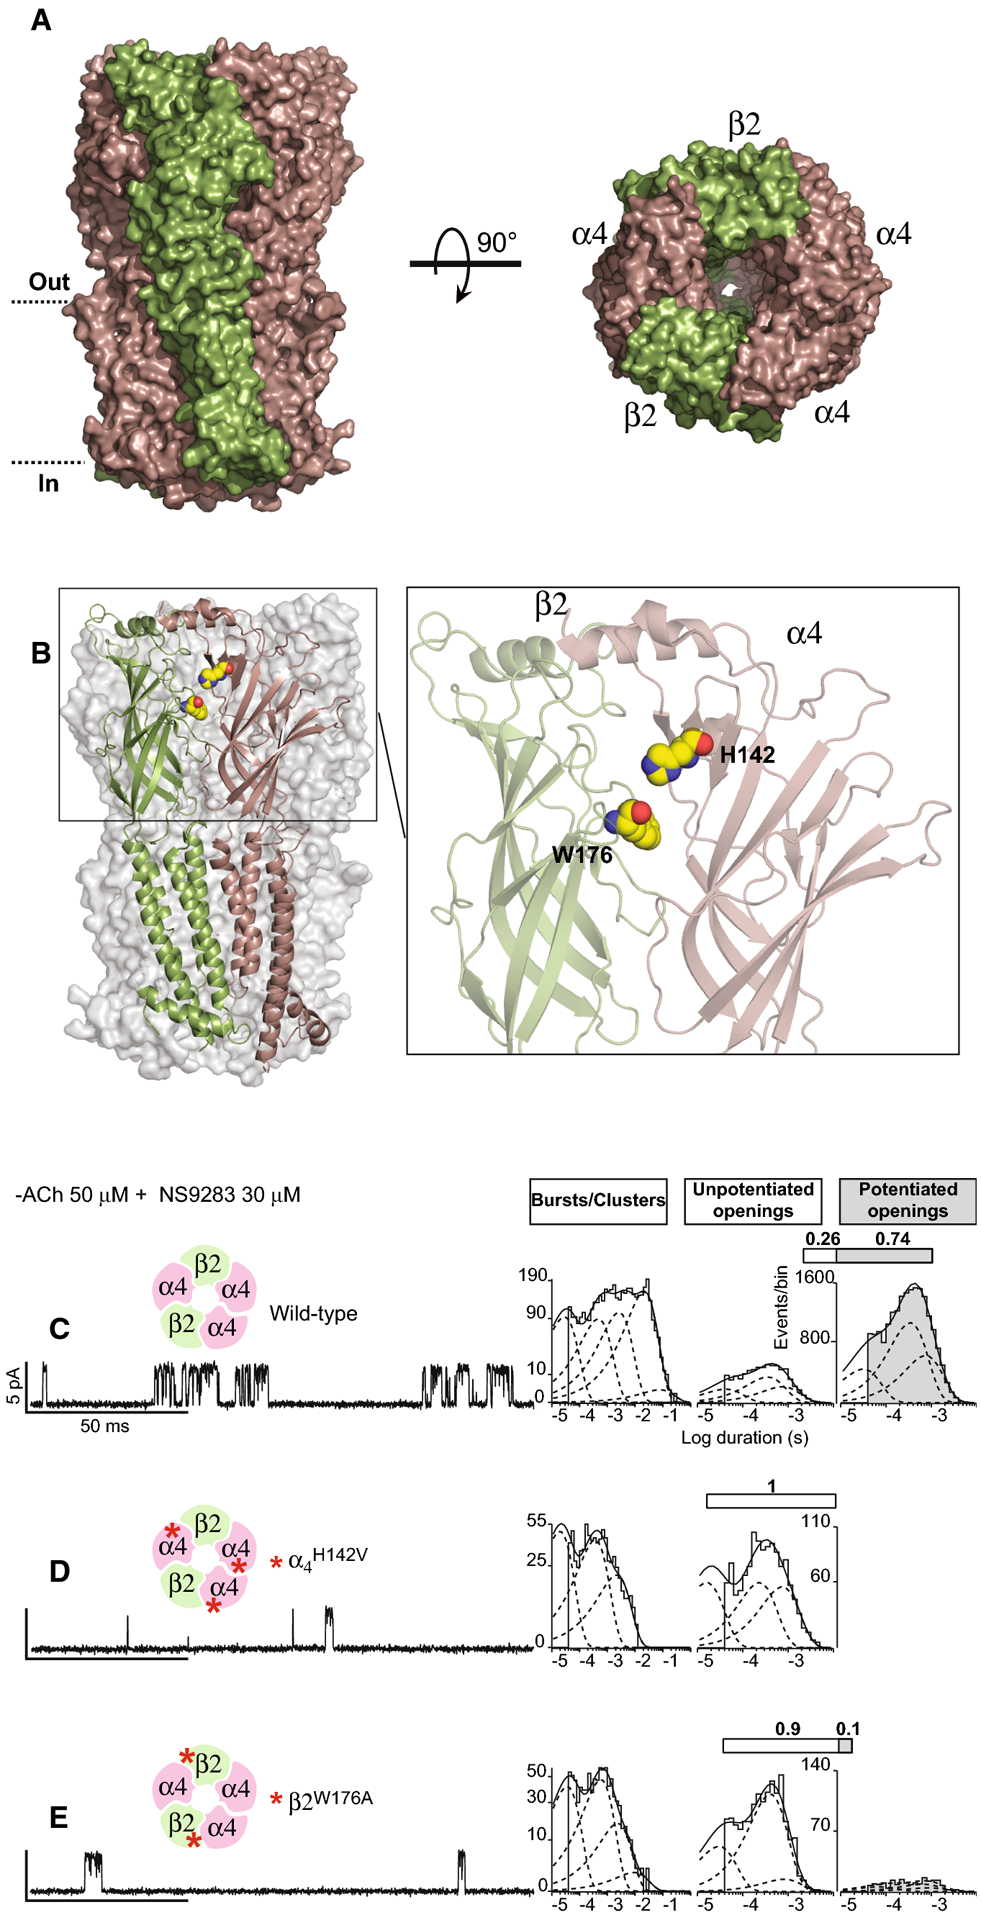
Figure 3. For AChRs formed from unlinked subunits, mutations in both β2 and α4 subunits block NS9283 potentiation.

(A, B) Panels show the recent cryo-EM structure of the (α4)3(β2)2 AChR (PDB code 6CNK). (A) Side (left) and top (right) views of the (α4)3(β2)2 AChR complex. (B) Left panel shows the structure of an β2-α4 subunit interface within the (α4)3(β2)2 AChR. Right panel shows a close up view of the β2-α4 subunit interface with residues subjected to mutation, β2W176 and α4H142, highlighted as spheres. (C-E) Single channel currents from wild type or mutant (α4)3(β2)2 AChRs were recorded in the presence of 50 μM ACh and 30 μM NS9283 (holding potential −70 mV, Gaussian filter 4 kHz). Red asterisks indicate locations of mutations. To the right of each trace is a histogram of cluster durations, corresponding to successive channel openings and intervening closings, fitted by the sum of exponentials (dashed curves); the component with longest mean duration, present for the wild type AChR, is reduced or absent for the mutant AChRs. To the right of the cluster duration histograms are histograms of channel openings classified as either un-potentiated (un-shaded) or potentiated (shaded) fitted by the sum of three exponentials. Above each histogram, the shaded portion of the bar indicates the percentage of channel openings that are potentiated.
