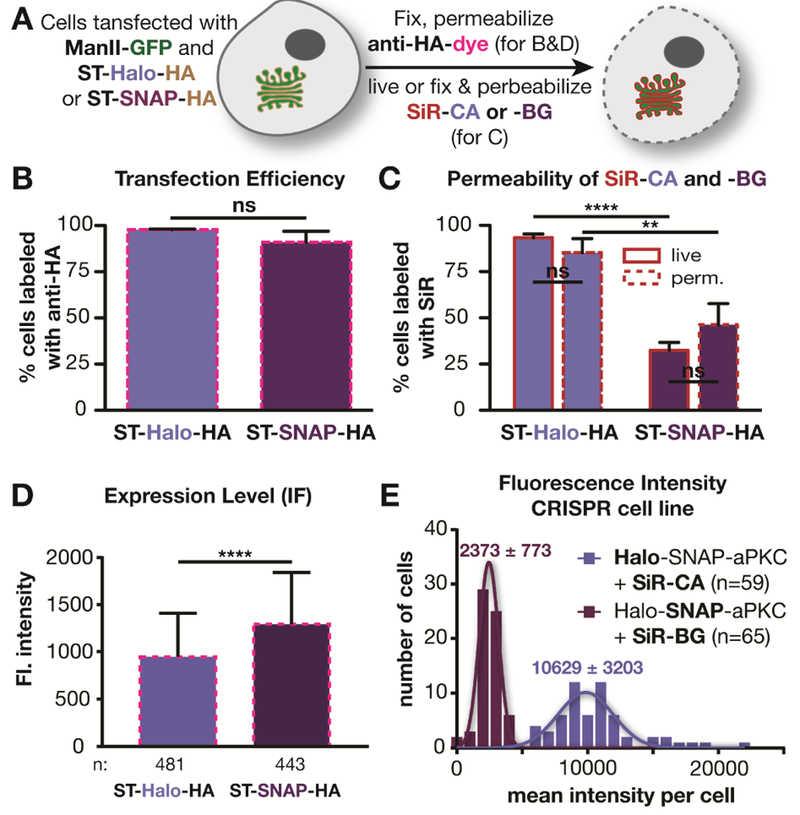
Figure 2.

Investigation of various factors that could cause a difference in labeling using SNAP or Halo tags. A) Scheme of labeling procedures used in B-D). B) Plot showing the percentage of cells expressing ManII-GFP that have also been immunolabeled with an antibody against the HA-tag in 3 independent experiments (ST-Halo-HA: 463 cells in total; ST-SNAP-HA: 489 cells in total). C) Comparison of labeling efficiency of live and permeabilized cells using SNAP and Halo-tag from 3 independent experiments (ST-Halo-HA: live: 740 cells in total, fixed and permeabilized: 456 cells in total; ST-SNAP: live: 837 cells in total, fixed and permeabilized: 542 cells in total). D) Average fluorescent intensity of immunostained cells as described in A). E) lntensity distribution in Drosophila egg chambers that are expressing Halo-SNAP-aPKC and have been labeled with SiR-CA or SiR-BG.
