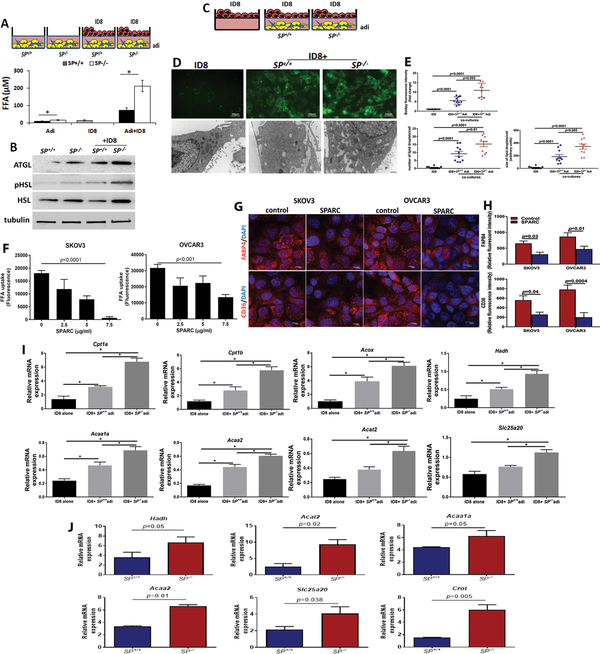
Figure 6: Effect of SPARC on metabolic programing of adipocytes and OvCa cells.
A. Schema of the co-culture (upper), Bars represent means ±SEM of FFA release in media of co-cultures for 48h. *p<0.05, Student’s t-test. B. WB showing increased lipases in adipocytes in mono- and co-cultures with ID8 cells. C. Schema showing co-cultures of ID8 and adipocytes. D. Photomicrographs of FA uptake by ID8 cells visualized by bodipy staining of in co-cultures (upper, 40x; scale bar 50μm) and electron microscopy (lower, 6800x; scale bar, 500nm). E. Quantification of bodipy fluorescence intensity in the in ID8 cells in mono- and co-cultures with adipocytes. The number and size of lipid droplets (lower) was quantified in 10 cells/condition. Plots represent means±SEM of the fluorescent intensity quantified in 10 fields/experimental condition (n=3 experiments), and unpaired t-test. F. Effect of SPARC on FA uptake by human OvCa cells. p<0.05, one way ANOVA. G. Immunofluorescence showing the effect of SPARC (5μg/ml) on FABP4 and CD36 expression in SKOV3 and OVCAR3 cells. Scale bars, 10μm. H. Bars report means ± SEM of fluorescence intensity of FABP4 and CD36 quantified in 10 fields/experimental condition, Student’s t-test. I. mRNA expression of enzymes involved in FA oxidation of ID8 in mono- and co-culture with SP+/+ and SP−/− adipocytes. Bars report means ±SEM of a representative of 3 independent experiments each in triplicates. *P<0.05. Student’s t-test. J. Bars depict mean ± SEM of the changes in the transcript levels (n=3/genotype). P values are determined by unpaired Student’s t-test.

