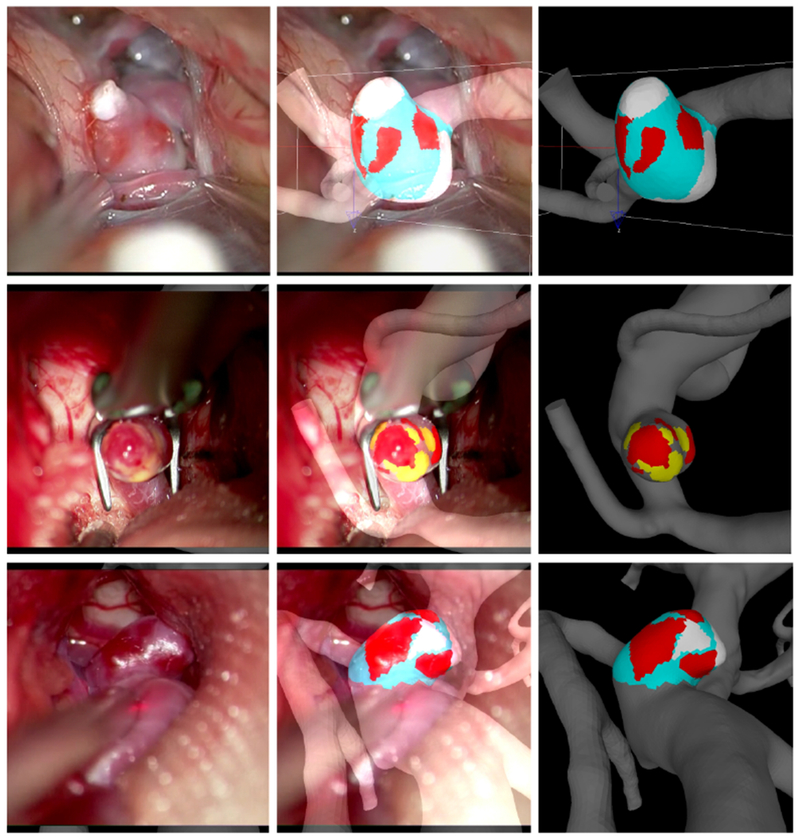
Figure 1.

Marking aneurysm regions in three example aneurysms. Left column: selected frames of intra-operative videos displaying aneurysm wall. Center column: superposition of semi-transparent video frame and marked 3D vascular model. Right column: final virtual marking of aneurysm wall regions (Red=thin, Yellow=atherosclerotic, White=Hyperplastic, Cyan=normal looking).
