
Figure 2.
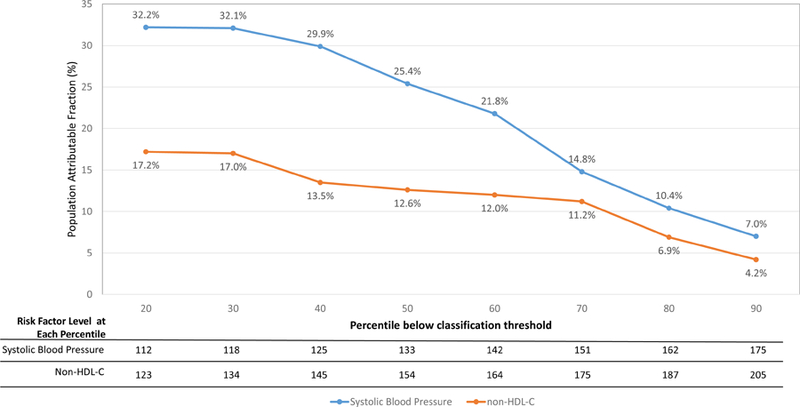
Population attributable fraction (PAF) for blood pressure and lipids as function of percentage of individuals below the classification threshold
The two curves present PAFs as function of risk factor level threshold, i.e. the percentage of coronary heart disease risk that could be eliminated if SBP or non-HDL-C levels never exceeded the numbers given in the table at the bottom (which correspond to the percentiles of risk factor distribution in our sample). For example, the PAF associated with keeping SBP below 125 mmHg (40th percentile) is 29.9%, but it drops to 21.8% for SBP below 142 mmHg (60th percentile).