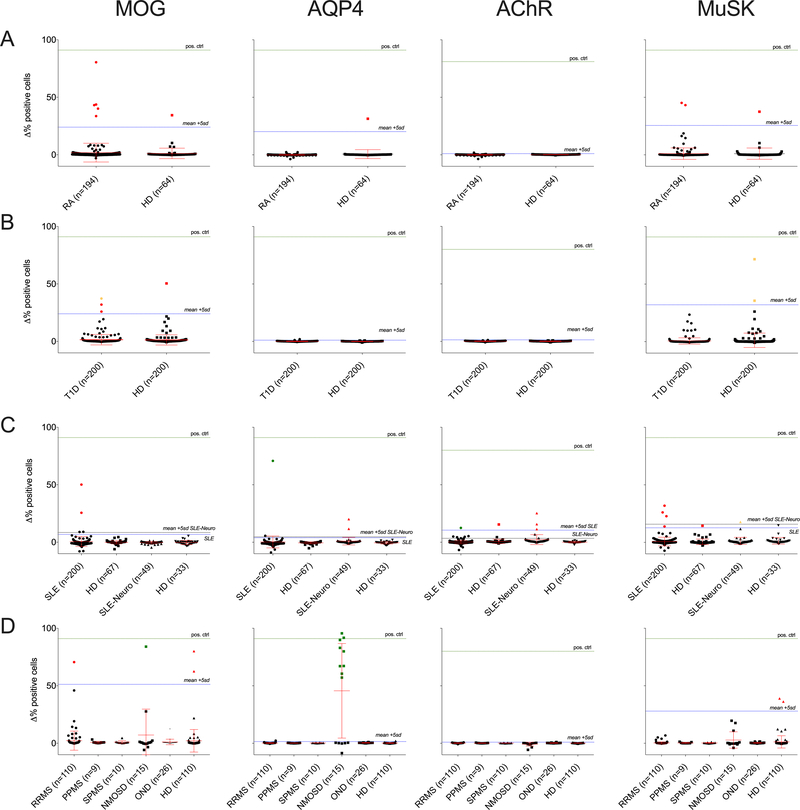
Figure 2.
Robot-assisted cell-based immunofluorescence assay screening and validation results for the RA (A), T1D (B), SLE (C), and Neurologic [MS, NMOSD, OND] (D) cohorts. The y-axis represents difference (Δ) in percentage of positive cells. Δ% positive cells values both greater than 5 standard deviations above the mean of the HD subjects of the cohort in question and greater than a Δ% positive cells value of at least 10% were considered positive in the robot-assisted cell-based immunofluorescence assay screening. Green dots represent positives from the screening assay that were verified in validation experiments, red dots represent positives that were not verified, and yellow dots represent samples where serum volume was not adequate for validation experiments.

