Figure 5.
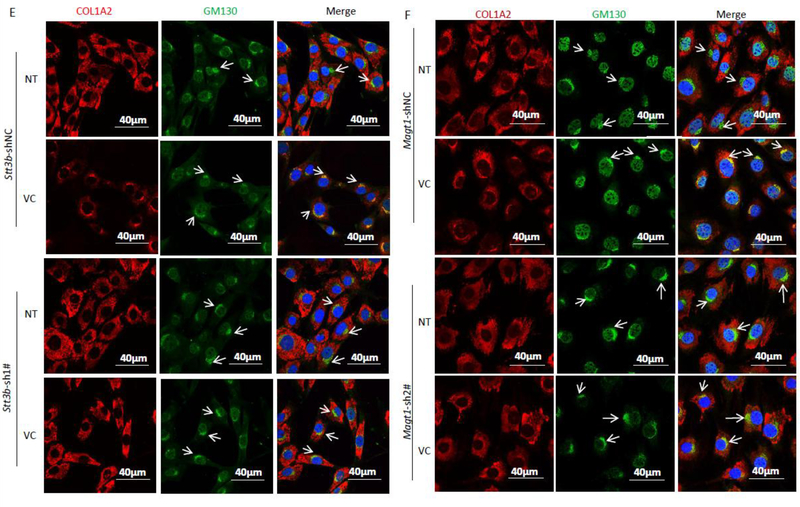
VC-induced N259-linked glycosylation on P4HA1 altered col 1α2 secretion. Enhanced col 1α2 in the culture medium and pepsin-resistant col 1α2 could be detected 3 hrs after VC treatment of MEF cells (top two panels) (A) or when VC concentration was ≥40 μM (top two panels) (B). MEF cells were treated with 50 μM of VC for different times (A) or with different concentrations of VC for 6 hs (B). Col 1α2 in cell lysates or in the culture medium was detected. Quantification of collagen in the medium and N113/N259 and N113glycosylated P4HA1 confirmed a correlation between N259 glycosylation and collagen in the medium ((A) & (B) graphic pictures, n=3). N113/N259 glycosylated P4HA1 (or di-glycosylated P4HA1, Di-) is the top band, N113 glycosylated P4HA1 (or mono-glycosylated P4HA1, Mono-) is the bottom band. Silencing Stt3b (C & E & G) or Magt1 (D & F) reduced VC-induced pepsin-resistant col 1α2 in the culture medium (C & D) and VC activated col 1α2 (red) entry into Golgi apparatus (green, indicated by arrow) (E&F). However, silencing Stt3b did not alter P4HA1 localization in ER (G). Stt3b- or Magt1-silenced or control MEF cells were treated with 50 μM of VC or without VC treatment for 6 hrs, col 1α2 was detected in the cell lysates or in the culture medium (C & D) or was detected by confocal immunofluorescence staining (E & F & G). The ER marker KDEL-EGFP was expressed in Stt3b downregulated MEF cells. P4HA1 was labeled with polyclonal antibody specific to P4HA1. Most P4HA1 co-localized with KDEL-EGFP. Nuclear staining for P4HA1 was non-specific. Quantification of intracellular collagen and pepsin-resistant collagen showed that silencing Stt3b or Magt1 significantly altered VC-induced pepsin-resistant collagen (n=4). Laminin was used as a loading control for culture medium protein whereas actin was used as a loading control for cell lysate. NT: no VC treatment; VC: VC treatment. * indicates col 1α2. Densitometry of immunoblots was quantified using Image J and depicted graphically.

