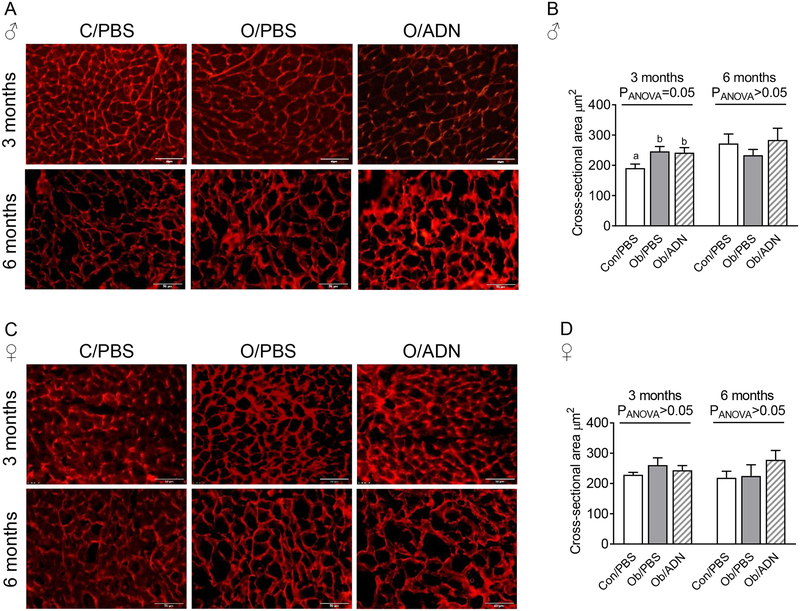
Figure 2. Cardiomyocyte cross-sectional area in 3-month-old offspring.
Representative images of wheat-germ agglutinin stained transverse cardiac sections (A, C) and mean ± SEM cardiomyocyte cross-sectional area in 3-month old male (n=7–10, B) and female (n=5–10, D) offspring of control, PBS infused pregnant mice (C/PBS) and obese pregnant mice infused either with PBS (Ob/PBS) or adiponectin (Ob/AND) from E14.5 to 18.5. Image scale bars represent 50μM. Overall effect of maternal treatment group by one-way ANOVA given in figure. Values with different superscripts, a or b, are significantly different from one another by pairwise post-hoc comparison (P<0.05, Holm-Sidak test).

