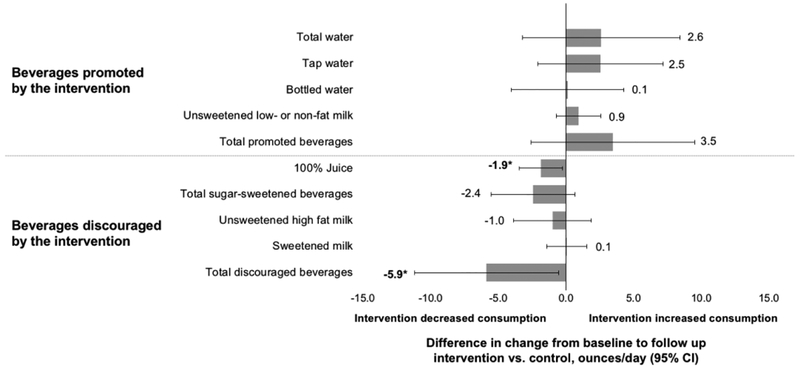
Figure 3.
Effects of a healthy beverages intervention on children’s at-home consumption of 11 beverage categories, n=154.
Notes. Figure shows differences in change in consumption from baseline to follow-up, comparing the healthy beverages intervention group to the control group. Differences were estimated using generalized linear regressions, controlling for sociodemographics, child’s age, and child’s sex and accounting for clustering within children and classrooms. Changes in consumption of subcategories may not sum to the changes in larger categories due to adjustment for covariates. *p<0.05

