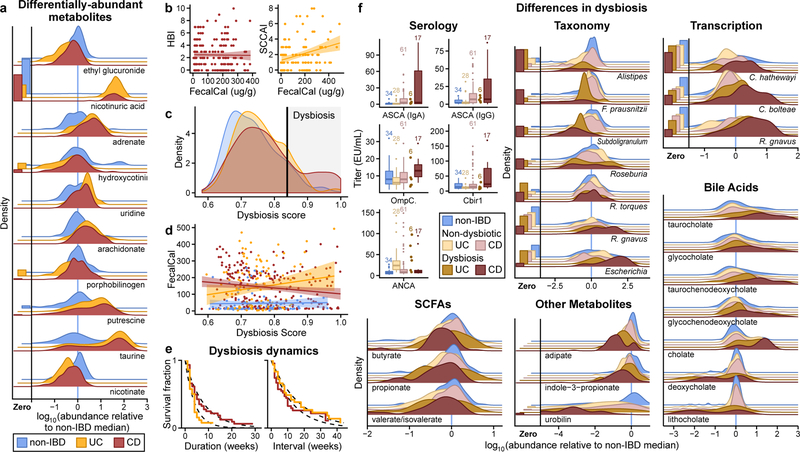
Figure 2. Metagenomic, metatranscriptomic, and stool metabolomic profiles are disrupted during IBD activity.
A) Relative abundance distributions for 10 of the most cross-sectionally significantly differentially abundant metabolites in IBD, as a ratio to the median relative abundance in non-IBD (Wald test; all FDR p < 0.003; Methods; full results in Supplementary Tables S1–14). Fraction of samples below detection limit on left (Methods). N=546 samples from 106 subjects. B) Relationships between two different measures of disease activity: patient-reported (Harvey-Bradshaw Index, HBI, in CD N=680 samples from 65 subjects; Simple Clinical Colitis Activity Index, SCCAI, in UC N=429 samples from 38 subjects) and host molecular (fecal calprotectin43 N=652 samples from 98 subjects). Linear regression shown with 95% confidence bound. C) Distribution of microbial dysbiosis scores as a measure of disease activity (median Bray-Curtis dissimilarity between a sample and non-IBD samples; Methods) and D) its relationship with calprotectin (N=652 samples from 98 subjects). Linear regression with 95% confidence. E) Kaplan-Meier curves for the distributions of the durations of (left) and intervals between (right) dysbiotic episodes for UC and CD subjects. Both are approximately exponential (fits in dashed lines), with a means of 4.1 and 17.2 weeks for UC, and 7.8 and 12.8 weeks for CD (Methods). F) Relative abundance distributions of significantly different metagenomic species (N=1,595 samples from 130 subjects), metabolites (N=546 samples from 106 subjects), and microbial transcribers (N=818 samples from 106 subjects) in dysbiotic samples compared to non-dysbiotic samples from the same disease group (Wald test; all FDR p < 0.05; full results in Supplementary Tables S15–28). Also shown are antibody titers for anti-neutrophil cytoplasmic antibodies (ANCA), anti-Saccharomyces cerevisiae mannan antibodies (ASCA, IgG or IgA), anti-OmpC, and anti-CBir1 antibodies (N=146 from 61 subjects). Boxplots show median and lower/upper quartiles; whiskers show inner fences; sample sizes above boxes.

