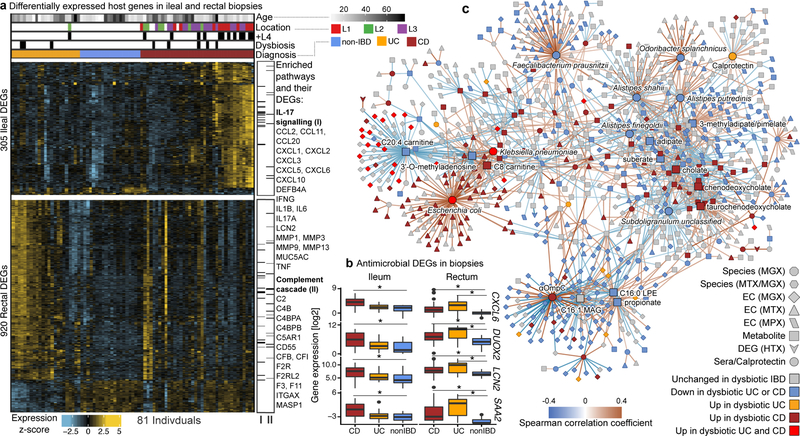
Figure 4. Colonic epithelial molecular processes perturbed during IBD and in tandem with multi’omic host-microbial interactions.
A) Differentially expressed human genes (DEGs) (negative binomial FDR p<0.05, min. fold change 1.5; Supplementary Table S31) from 81 subjects with paired ileal and rectal biopsies. Ordering by diagnosis, clustering within diagnosis. IL-17 signaling (I) showed strongest enrichment in ileal DEGs (FDR p=8.2 × 10⁻¹²)31, while the complement cascade (II)45 was enriched in rectal DEGs of UC patients (FDR p=5.2 × 10⁻⁸; KEGG30 gene sets, Supplementary Table S32). Example DEGs shown with I and II. B) Expression of four genes involved in host-microbial interactions26–29. Inflamed biopsy samples are shown for CD in ileum (left column, N=20, 23, 39 independent samples for non-IBD, UC, CD respectively); for CD and UC in rectum (right column; N=22, 25, 41 independent samples for non-IBD, UC, CD); non-IBD samples were non-inflamed. Stars indicate significant differential expression compared to non-IBD (Fisher’s exact, FDR p<0.05; p-values in Supplementary Table S31). Boxplots show median and lower/upper quartiles; whiskers inner fences. C) Significant associations among 10 different aspects of host-microbiome interactions: metagenomic species, species-level transcription ratios, functional profiles captured as EC gene families (MGX, MTX and MPX), metabolites, host transcription (rectum and ileum), serology, and calprotectin (sample counts in Fig. 1B–C). Network shows top 300 significant correlations (FDR p<0.05) between each pair of measurement types (for serology, FDR p<0.25). Nodes colored by the disease group they are “high” in, edges by sign and strength of association. Spearman correlations use residuals of a mixed-effects model with subjects as random effects (or a simple linear model when only baseline samples were used, i.e. biopsies) after covariate adjustment (Methods). Time points approximately matched with maximum separation 4 weeks (Methods). Singletons pruned for visualization (Extended Data Fig. 8). Hubs (nodes with ≥20 connections) emphasized.

