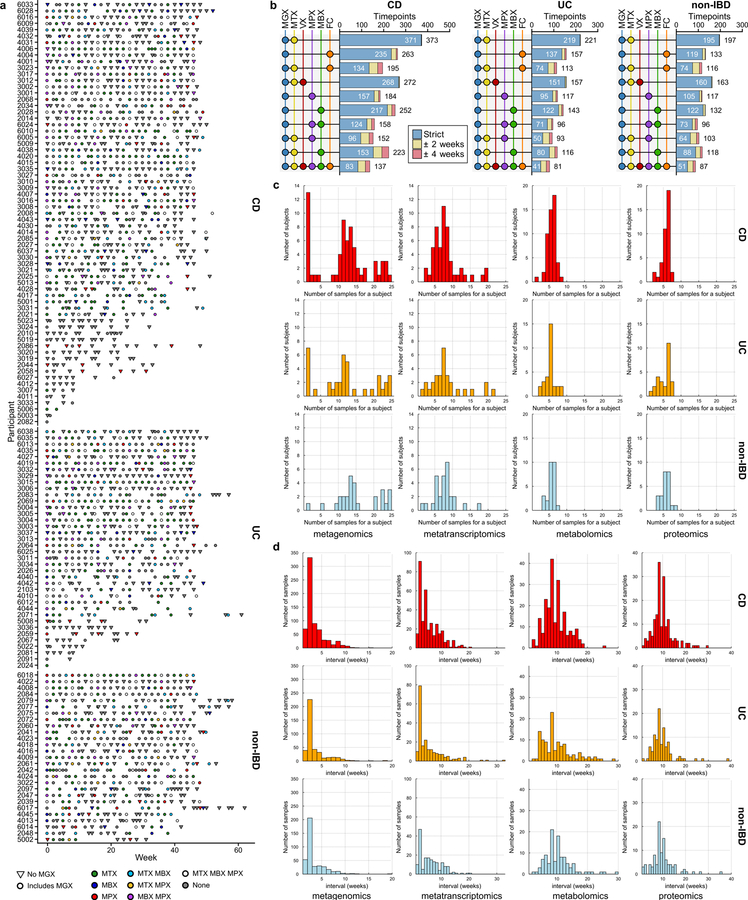
Extended Data Figure 1. Distribution of sample and measurement types and timing.
A) Measurements available over time for each IBDMDB participant. B) Number of identical or closely-aligned time points available for which each measurement type has been generated (Methods). C) Distributions of the number of processed samples per subject, stratified by disease and measurement type. D) Distributions of time intervals between consecutive samples for each measurement type.

