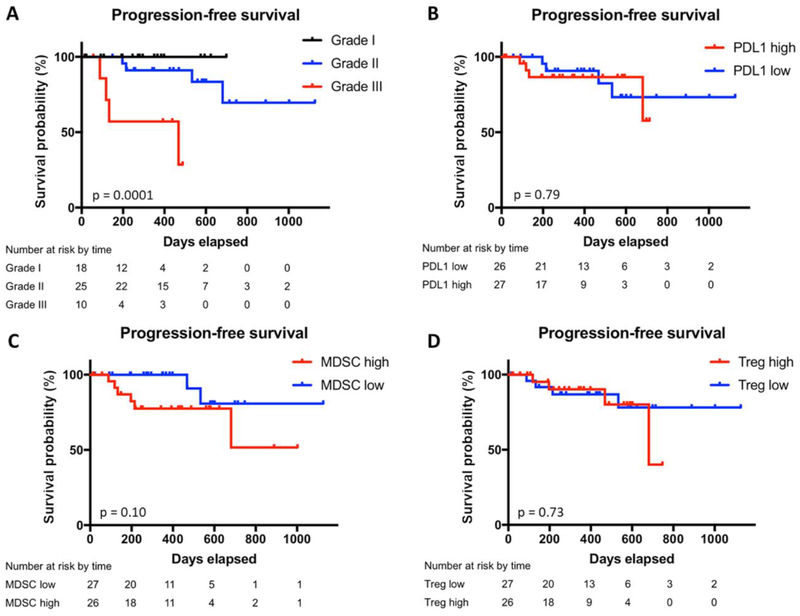
Figure 2: Progression-free survival by WHO grade, PD-L1 expression, MDSC abundance, and Treg percentage.
Kaplan–Meier estimates of progression-free survival in the subgroup of patients with peripheral blood analysis divided by WHO grade (a), expression of PD-L1 on peripheral myeloid cells (b), peripheral MDSC abundance (c), and peripheral Treg percentage (d). Vertical ticks indicate time points at which patients were censored.

