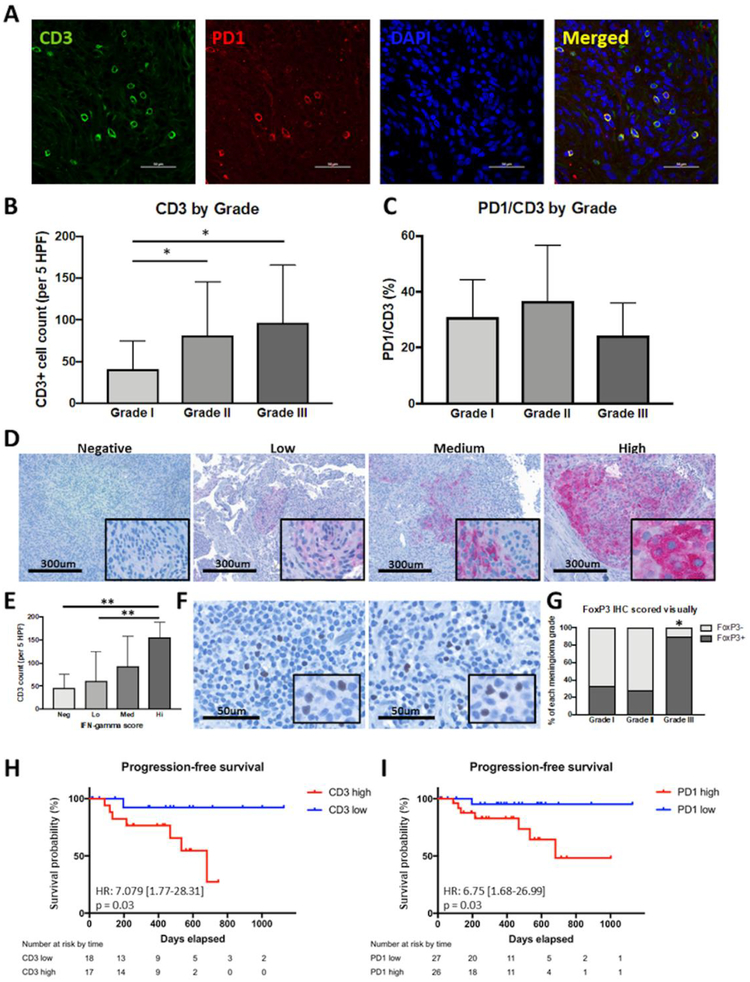
Figure 4: T-cell infiltration of meningiomas.
(a) Representative immunofluorscent staining of CD3 and PD1 in FFPE tumor sections. (b) Quantification of T-cell infiltration by grade. Grade II (81.4 cells/5 HPFs) and III (96.8 cells/5 HPFs) tumors had greater CD3+ T-cell infiltration compared to grade I (40.9 cells/5 HPFs) tumors (* p < 0.01). (c) Quantification of PD1 expression on T-cells by grade. Expression of PD1 on CD3+ T-cells did not vary significantly between tumor grades. (d) Representative IHC staining of IFN-γ in FFPE tumor sections with negative, low, medium and high IFN-γ expression. (e) Summary of CD3+ T-cell infiltration grouped by degree of IFN-γ expression. Tumors with increased T-cell infiltration also had increased IFN-γ expression (** p < 0.01). (f) Representative IHC staining of FoxP3 in FFPE tumor sections. (g) Quantification of FoxP3 positivity by grade. Grade III tumors (90%) had significantly increased FoxP3 positivity compared to grade I (33%) and II (28%) tumors (* p < 0.001). (h) Kaplan–Meier estimates of progression-free survival by T-cell infiltration in grade II and III meningiomas. (i) Kaplan–Meier estimates of progression-free survival by PD1 positivity in all meningiomas.

