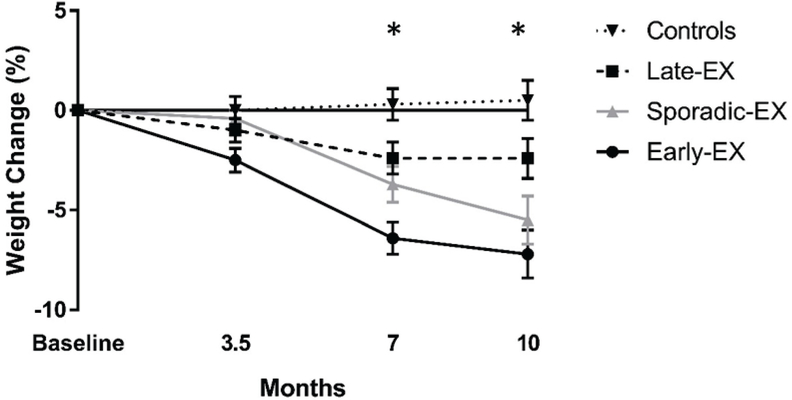
Figure 1.
Mixed model results for weight change (%) at months 0, 3.5, 7, and 10 by group.
Group effect (p=0.025), Time Effect (p<0.0001), Group*Time Effect (p <0.0001).
*Significant at Month 7: Early-EX > controls (p=0.005), Early-EX > Late-EX (p=0.010)
*Significant at month 10: Early-EX > controls (p<0.001), Early-EX > Late-EX (p<0.001), Sporadic-EX > controls (p=0.012)

