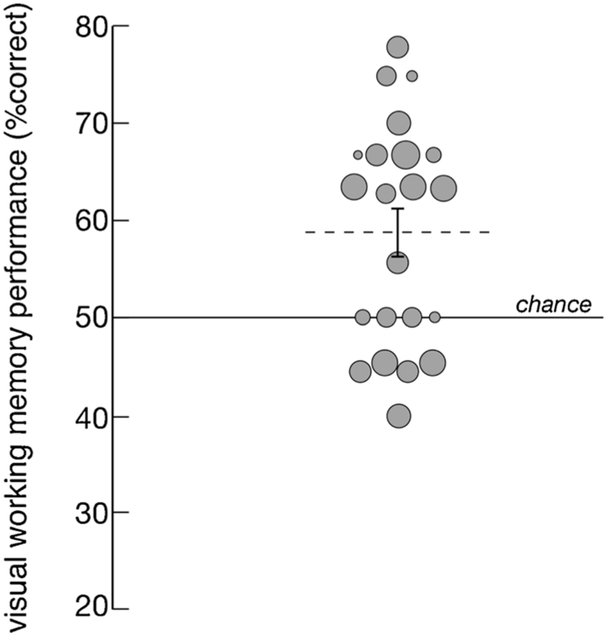
Fig. 2.
Individual and group average VWM performance (percent correct responses based on first looks). Each data point represents an infant participant, and the size of the point corresponds to the number of valid trials the infant contributed. Dotted line indicates average performance (error bar reflects SEM). Solid line indicates chance level (50%).

