Fig. 3.
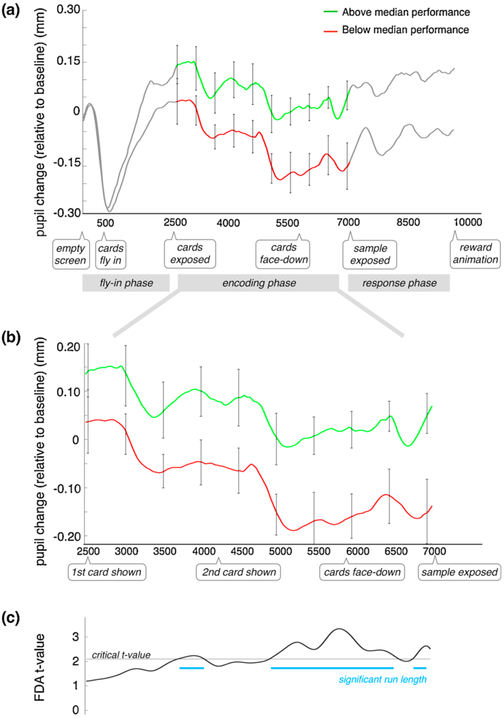
(a) Mean task-evoked pupil responses (TEPR), over time (ms), based on a median-split of individual VWM performance. Relevant trial events and phases are indicated below the time axis. The encoding phase is demarcated by the colored portion of the traces: the green curve reflects the mean pupil trace of the 10 above-median participants; red curve, the lower 10. Pupil values correspond to changes in (For interpretation of the references to colour in this figure legend, the reader is referred to the web version of this article). diameter (mm), relative to baseline (subtractive baseline correction was based on the first 500 ms of the trial). Error bars reflect SEM. (b) Data from (a), shown just for the encoding phase, to aid visualization. (c) Results of functional data analysis over the encoding phase, showing the uncorrected t-statistic based on the sets of median-split traces. The black horizontal line indicates the critical t-value (p < 0.05, two-tailed). A permutation test was applied; blue lines indicate regions deemed to have significantly long (p < 0.05) runs of above-critical tvalues (Oakes et al., 2013).

