Fig. 4.
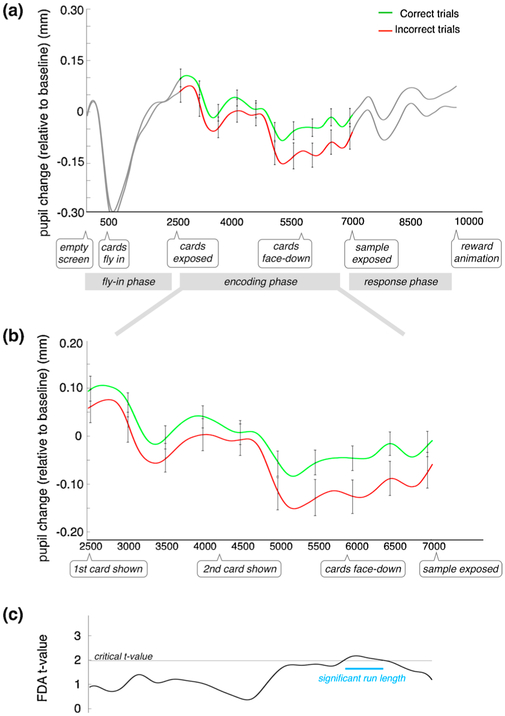
(a) Mean TEPR based on a binning of trials as either correct (N = 80) or incorrect (N = 52). Relevant events during the trial are indicated below the time axis. The encoding phase is demarcated by the colored portion of the traces: the green curve reflects the mean of all trials that ended in a correct response; red curve, incorrect. Error bars reflect SEM. (b) Data from (a), shown just for the encoding phase, to aid visualization. (c) The t-value from a functional t-test between the sets of correct/incorrect traces. The blue line indicates the results of the permutation test (For interpretation of the references to colour in this figure legend, the reader is referred to the web version of this article).

