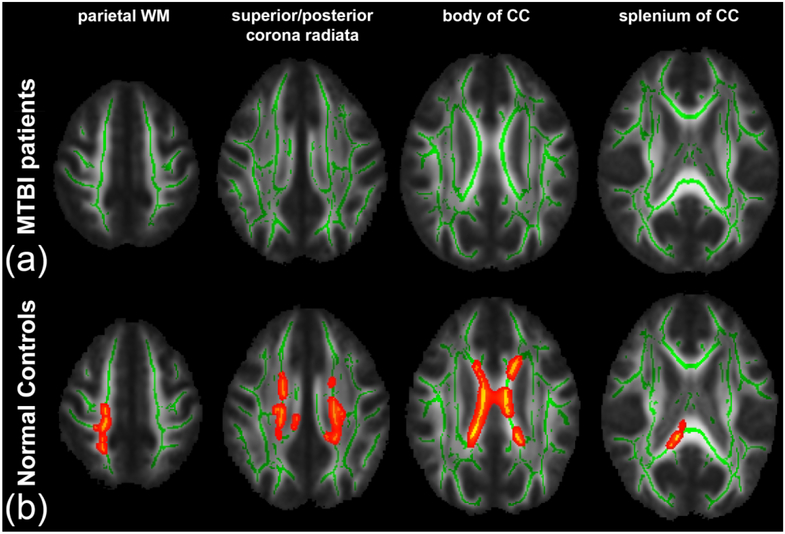
Figure 3.
TBSS results show a significant positive correlation between AWF and LNS. Mean FA skeleton (green) overlaid on the mean FA map. Significantly correlated voxels (corrected p < 0.05) are shown in heat map overlay. (a) In the MTBI group, no correlation was found. (b) In the NC group, significantly correlated voxels involve parietal WM, sCR/pCR and bCC/sCC.

