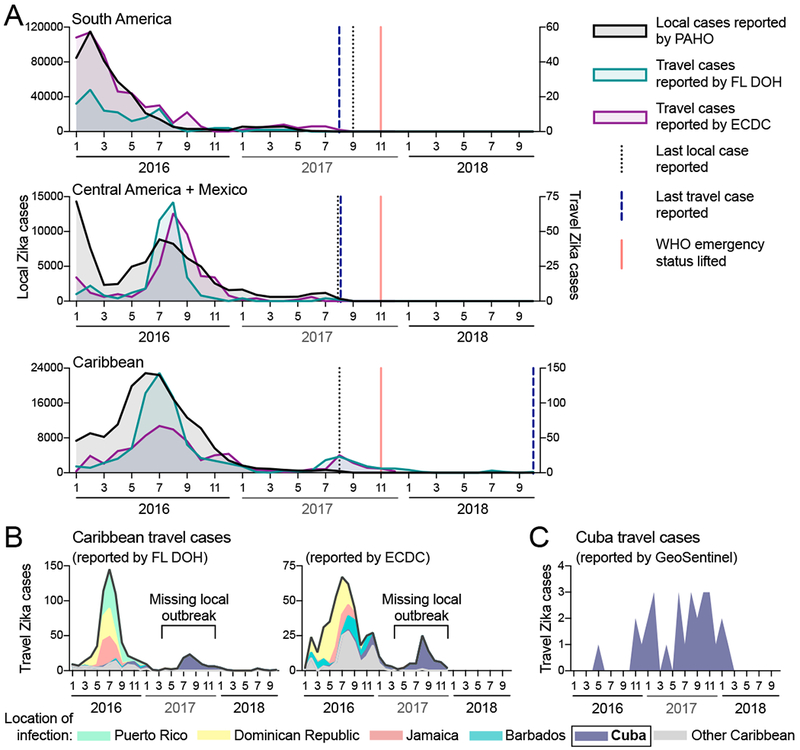
Figure 1. International travel cases reveal unreported Zika outbreak in Cuba in 2017.

Local and travel-associated Zika cases were used to determine if outbreaks were still occuring during 2017. (A) Monthly local Zika cases (left y-axis) reported by the Pan American Health Organization (PAHO) and monthly travel-associated Zika cases (right y-axis) reported by the Florida Department of Health (FL-DOH) and the European Centre for Disease Prevention and Control (ECDC) were sorted by origin of exposure. The vertical lines represent the months the last local and travel cases were reported per region, and the month that the World Health Organization (WHO) Public Health Emergency of International Concern status was lifted for the Zika epidemic (November, 2017). In each region, travel cases and local cases were correlated (Pearson r range = 0.542-0.976, each comparison can be found in Supplemental File 1). (B) The total number of Zika cases reported by the FL-DOH and the ECDC associated with travel originating in the Caribbean are shown (black line) and are shaded by the top 5 origin locations (all other placed in the ′Other Caribbean′ category). (C) Zika cases associated with travel from Cuba, diagnosed by the GeoSentinel Surveillance Network, were sorted by month of clinic visit. Travel cases diagnosed by the GeoSentinel Surveillance Network originating from other parts of the Americas are not shown. See also Figure S1. The data used for this figure can be found in Supplemental File 1.
