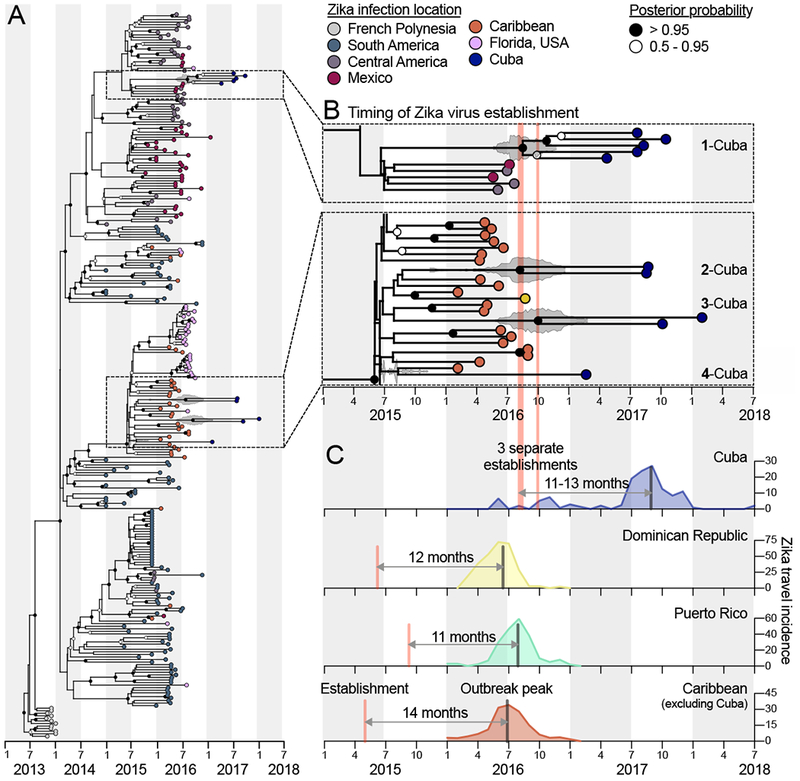
Figure 4. The establishment of Zika virus from other Caribbean islands was delayed in Cuba.

Genomics approaches were used to determine the timing and sources of the Zika virus introductions into Cuba. (A) A time-resolved maximum clade credibility (MCC) tree was constructed using 283 near complete Zika virus protein coding sequences, including 10 sequences from travelers returning from Cuba during 2017-2018. (B) The zooms show the likely times of Zika virus establishment (i.e., tMRCAs) for each of the Cuba clades, as well as potential introduction sources (i.e., locations of the sequences basal on the tree). The fill color on each tip represents the probable location of infection, the clade posterior probabilities at each node are indicated by white circles filled with black relative to the level of posterior support, and the grey violin plot indicates the 95% HPD interval for each tMRCA. The mean tMRCA for clade 1-Cuba was August, 2016 (95% HPD = May-November, 2016), the mean tMRCA for clade 2-Cuba was July, 2016 (95% HPD = March-December, 2016), and the mean tMRCA for clade 3-Cuba was September, 2016 (95% HPD = May, 2016-February, 2017). Clade ‘Cuba-4’ does not have a tMRCA estimate because it consists of a single sequence. A maximum likelihood tree and a root-to-tip molecular clock are shown in Figure S6. (C) The three separate estimated Zika virus establishment times with tMRCA estimates into Cuba are shown with the Zika virus travel incidence rates (travel cases/100,000 travelers, as calculated for Figures 2, 3). The estimated earliest Zika virus establishment times (based on the MCC tree in A) and travel incidence rates for the Dominican Republic, Puerto Rico, and the Caribbean as a whole (minus Cuba) are shown to compare the times from establishment of the virus to outbreak peak. See also Figure S6. GenBank access numbers of Zika virus genomes sequenced during this study can be found in Supplemental File 2, the data used to create (A and B) can be found in Supplemental File 3, and the data used to create (C) can be found in Supplemental File 1.
