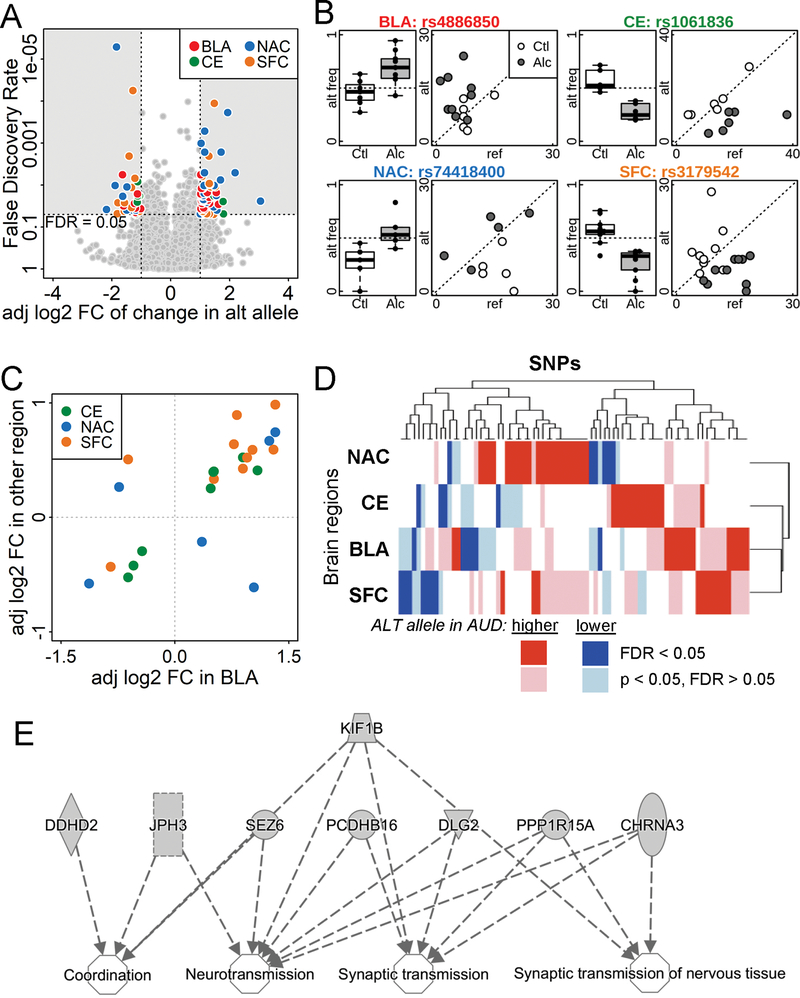
Figure 2.
Allele-specific expression in the postmortem brain samples from subjects with and without AUD. (A) Volcano plot comparing the adjusted log2 fold change (adj log2 FC) and false discovery rate (FDR) of the percentage of alternative alleles between AUD subjects and controls. SNPs with FDR < 0.05 and adjusted log2(fold change) > 1 or < −1 were color-coded by brain region. BLA = basolateral nucleus of the amygdala, CE = central nucleus of the amygdala, NAC = nucleus accumbens, and SFC = superior frontal cortex; alt = alternative. (B) Alternative allele frequency box plot and a scatter-plot of the number of reference and alternative reads for one significant SNP from each brain region (symbols noted above). alt freq = alternative allele frequency; Ctl = social/non-drinking control subjects; Alc = AUD subjects; ref = reference. (C) Consistency in the adj log2 FC in different brain regions. SNPs with FDR < 0.05 in BLA and p < 0.05 in another brain region are plotted by adjusted fold change, color-coded by the other brain region. Of the 24 SNPs, 20 had consistent fold change direction in the two brain regions. (D) Heatmap of adjusted fold change of SNPs with FDR < 0.05 in at least one brain region shows consistency in fold change among all 4 brain regions. Dark and light colors indicate genome-wide significant (FDR < 0.05), or borderline significant (FDR > 0.05 but p < 0.05), respectively. Red and blue indicate increased and decreased percentage of alternative allele in the AUD brain comparing to control group. (E) Ingenuity Pathway Analysis results of genes enriched in nervous system development and function.

