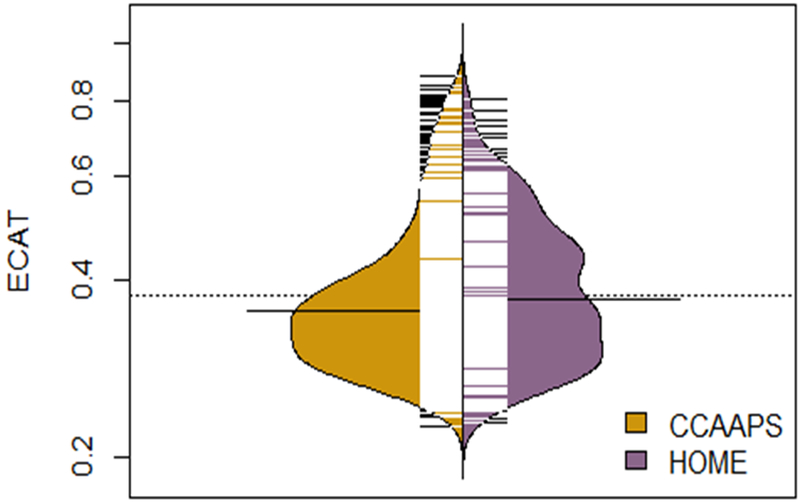
Figure 1. Bean plot of the distribution of elemental carbon attributable to traffic (ECAT) concentrations among the HOME Study and CCAAPS.

ECAT concentration (μg/m3) is on a natural-log y-axis. Each black and white mark represents a study participant and the bold black lines near the center indicate median concentrations in each cohort.
HOME, Health Outcomes and Measures of the Environment; CCAAPS, Cincinnati Childhood and Air Pollution Study
