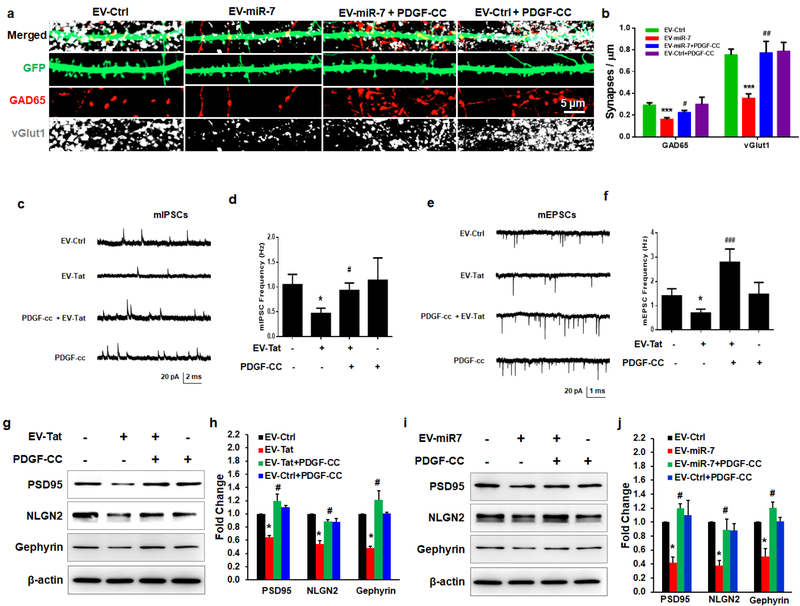
Figure 5. Protective effect of PDGF-CC in EV-miR-7-mediated synaptic alterations.
Representative confocal images of GFP-expressing primary rat hippocampal neurons exposed to EV-miR-7 followed by treatment with PDGF-CC (20 ng/ml) and stained with vGlut1 & GAD65 (a) and quantification of excitatory & inhibitory synapses (b). Representative traces of whole-cell voltage-clamp recording showing mEPSC (c), mIPSC (e), mean mEPSC frequencies (d), and mean frequencies of mIPSCs (Hz; f) in primary rat neurons (DIV 19–21) treated with combinations of ADEVs and PDGF-CC as indicated. (g, i) Representative western blot (h, j) and quantification of PSD95, NLGN2, and Gephyrin in the cell lysates of neurons exposed to ADEVs followed by treatment with PDGF-CC (20 ng/ml) for an additional 24 h. One way ANOVA with post hoc test. Bars represent mean ± SD from 3 independent experiments. * p < 0.05; ** p < 0.01 vs control; # p < 0.05, ## p < 0.01 versus treated group.

