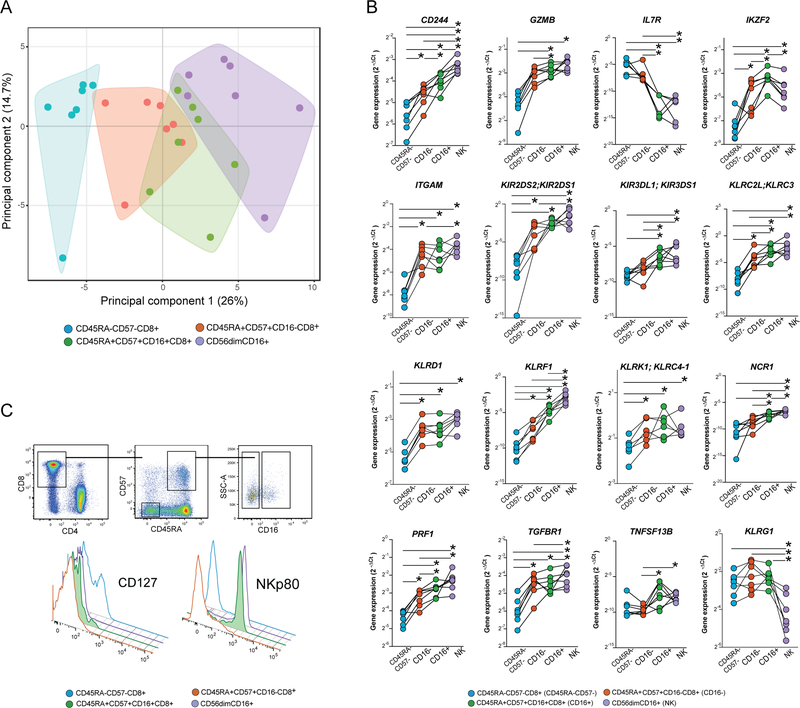
FIGURE 4.
Transcriptome analysis reveals a mixed CD8 T cell and NK cell character in the FcγRIIIA+ CD8 T cells. Supervised expression analysis of 74 genes involved in the regulation and function of innate and adaptive immune responses in 7 HIV-1 infected donors using the Fluidigm Biomark system. (A) Principal component analysis of the transcriptional data from four sorted cell populations reflecting CD45RA-CD57-(blue), CD45RA+CD57+FcγRIIIA-(red), CD45RA+CD57+FcγRIIIA+ (green), as well as CD56dimFcγRIIIA+ NK cells (purple). Polygons represent 95% confidence intervals in the data. (B) Expression of 10 selected genes in the same sorted subsets; (C) Successive flow cytometry gating strategy used for confirmation of IL7Ra and KLRF1 genes at the protein level. Offset histograms showing the relative expression of IL7Ra (CD127) and KLRF1 (NKp80) on CD8 T cells; CD45RA-CD57-(blue), CD45RA+CD57+FcγRIIIA-(red), CD45RA+CD57+FcγRIIIA+ (green/filled), as well as CD56dimFcγRIIIA+ NK cells (purple).

