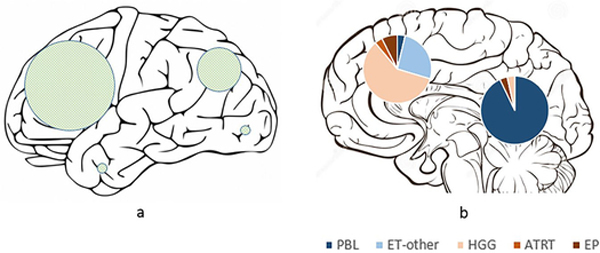
Fig 1.

Schematic representation of (a) the external surface of cerebral hemispheres showing the locations of hemispheric tumors, with the sizes of the shaded circles proportional to the number of tumors in each lobe; and (b) midline sagittal section of the brain showing pineal and non-pineal tumors, with pie diagrams representing the subgroups.
