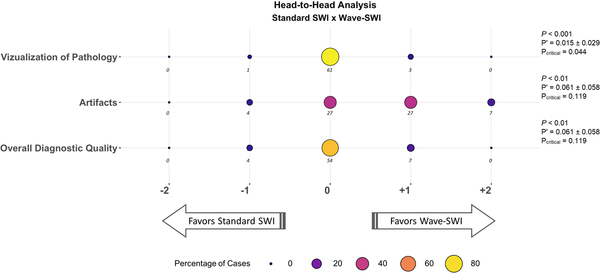
Figure 4.
Balloon plot showing the results of the head-to-head comparison of standard susceptibility-weighted imaging (SWI) and Wave-CAIPI SWI (Wave-SWI). The size and the color of each circle represents the percentage of cases that were assigned a given score, from a total of 65 abnormal cases. The actual number of cases receiving a given score is indicated below each circle. Negative scores (left) favor standard SWI, and positive scores (right) favor Wave-SWI. The proportion of cases where T2*w-GRE was preferred over Wave-SWI (P’) and the 95% confidence interval for this proportion are indicated at the right of the figure. The critical value (Pcritical) is also provided, corresponding to the upper bound of the 95% confidence interval for P’. Non-inferiority testing was performed as described in the methods, and the corresponding P-values are shown in the figure. Wave-SWI was non-inferior to standard SWI for the three variables evaluated.

