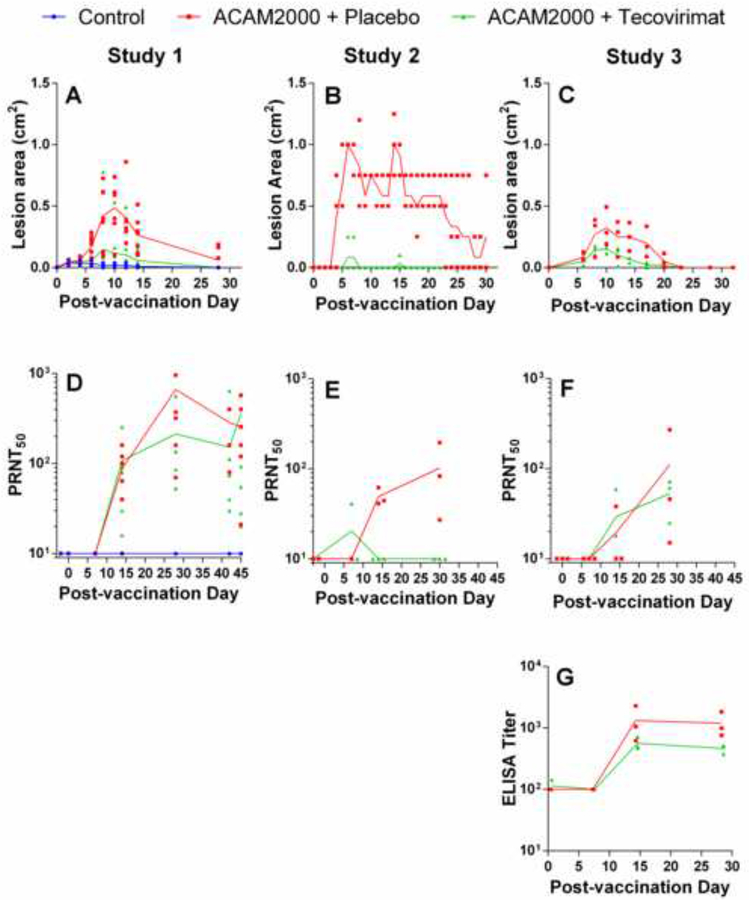
Figure 2.
Effect of tecovirimat treatment on response to ACAM2000 vaccination in cynomolgus (Studies 1 and 2) and rhesus (Study 3) macaques. NHPs were inoculated by epidermal scarification with ACAM2000 or vaccine diluent and concurrently treated with placebo or tecovirimat (10mg/kg, once daily) for 14 days. Vaccination site lesion area (A-C) and VACV PRNT50 (D-E) were monitored on all studies and anti-VACV ELISA titers were determined on study 3 (G). PRNT50 data were collected up to the day of MPXV challenge in all studies and the time between vaccination and MPXV challenge varied between 28 and 45 days depending on the study. 45 days are shown on the x-axis for all studies regardless of time between vaccination and MPXV challenge to allow presentation of all pre-challenge data for Study 1. Study Group sizes were as follows: Study 1 Control (n=3), ACAM2000+Placebo (n=7) and ACAM2000+tecovirimat (n=7); Study 2 ACAM2000+Placebo (n=3) and ACAM2000+tecovirimat (n=3); Study 3 ACAM2000+Placebo (n=3) and ACAM2000+tecovirimat (n=3). Individual animal data are plotted on all figures. Connecting lines are plotted through group mean values for lesion area and group geometric mean values for PRNT50 and ELISA measurements. The unusual appearance of individual animal data in panel B is due to reporting of vaccination site lesion area in increments of 0.25 cm2.

