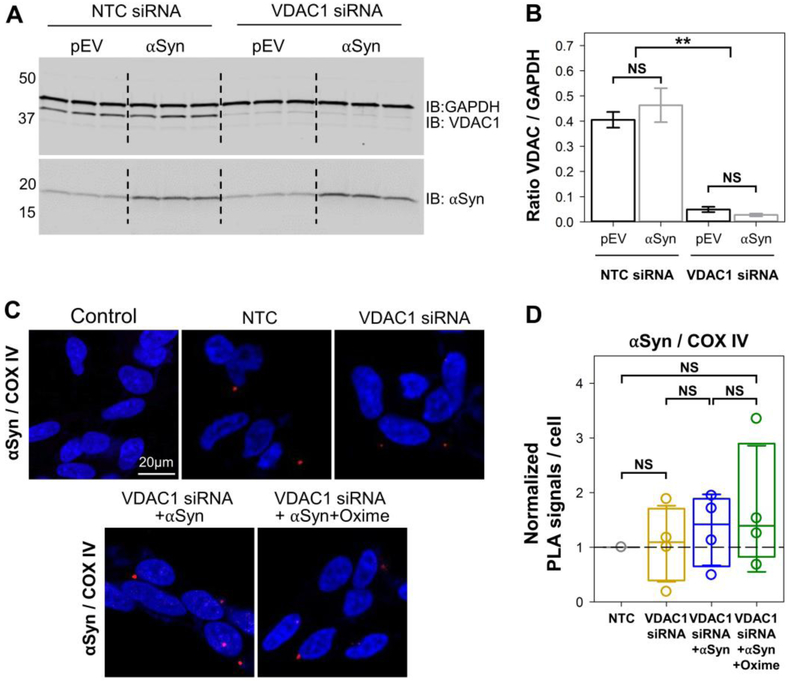
Fig. 3. αSyn colocalization with COX IV at the inner membrane is lost upon downregulation of VDAC1 expression.
(A) Western blot of VDAC1 protein levels in differentiated SH-SY5Y cells transfected with a non-targeting sequence (NTC) siRNA or VDAC1-siRNA. GAPDH was used as a loading control and maintenance of αSyn overexpression under these conditions has been validated. (B) Quantification of the Western blot analysis as intensity ratios of VDAC1/GAPDH. Data is presented as mean ± S.D. (n = 3). In VDAC1-siRNA cells, the VDAC1/GAPDH ratio is significantly less than in NTC control. (C) Representative confocal images of PLA of VDAC1 and COX IV colocalization in controls and cells depleted of VDAC1, overexpressing αSyn alone or treated with olesoxime. The nuclei are stained in blue (DAPI) (63x objective, scale bar 20μm). (D) Box plot represent the normalized distribution of PLA signals per cell, obtained from an average of 180 cells per experiment with a minimum of 60. The PLA signals were normalized to averaged PLA value measured in the NTC control cells of the corresponding experiment. The dashed line indicates a normalized PLA signal in NTC cells. Error bars indicate S.D. At least 3 independent experiments were performed for each pairwise of antibodies. In B and D, **: p < 0.01; NS (not significant): p ≥ 0.2; one-way ANOVA.

