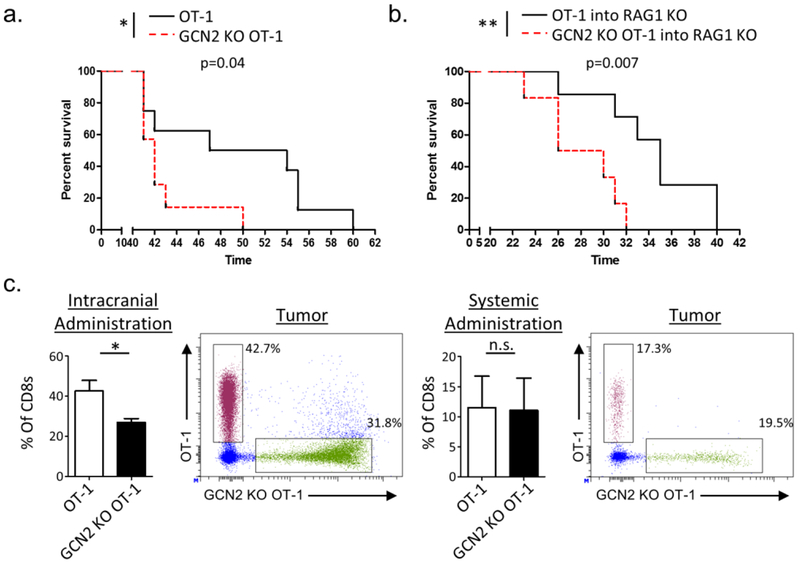
Fig. 3: GCN2 promotes antigen-specific CD8+ T-cell responses against glioma.
In (a), WT OT-1 and GCN2 KO OT-1 mice were challenged directly with 4X10⁵ GL-261 OVA and were analyzed for survival. In (b) OVA activated CD8+ T-cells from WT OT-1 or GCN2 KO OT-1 mice were transferred i.c. into tumor-bearing Rag1 KO hosts and analyzed for survival. In (c) OVA activated CD8+ T-cells from WT OT-1 and GCN2 KO OT-1 mice were isolated and labeled with cell proliferation dye eFluor 450 (GCN2 KO CD8+ T-cells) and cell proliferation dye eFluor 670 (WT CD8+ T-cells), and were transferred at a 1:1 ratio into GL-261 OVA tumor-bearing mice either i.c. (Left panel) or i.v. (Right panel). After three days, mice were sacrificed for flow cytometric analysis. In (a-b), Kaplan-Meier curves were generated from n=7 mice per group from two independent experiments, and statistical significance calculated using the Log-Rank analysis. In (c) flow cytometry statistics calculated from n=3 mice per condition. Unpaired T-test analysis was used to calculate significance. p<0.05*; p<0.01**.

