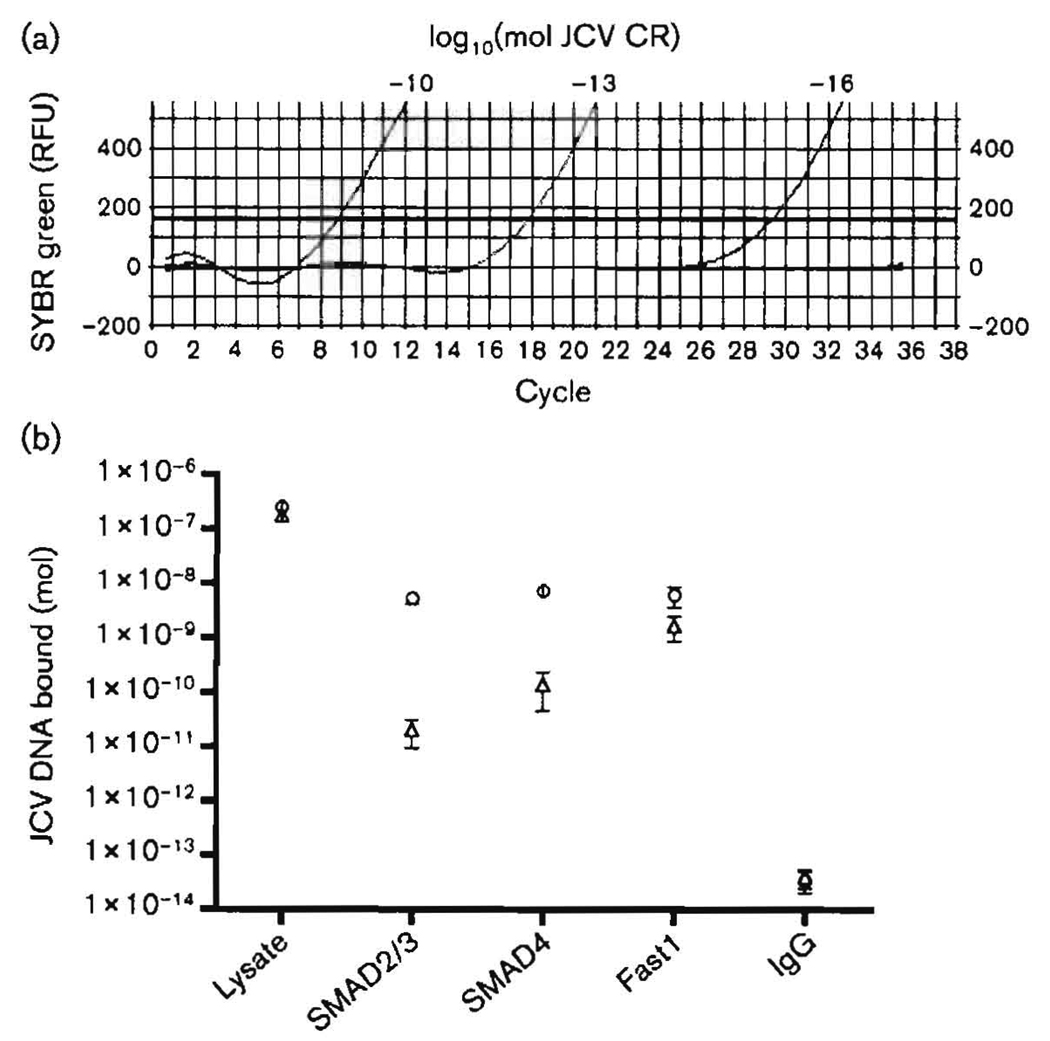
Fig. 4.
Detection of endogenous SMAD proteins bound to the JCV CR by ChIP and real-time PCR. Real-time PCR was performed using primers to amplify the JCV CR as shown in Fig. 3. Melting curves showed a single PCR DNA peak. (a) Real-time PCR for detection of small amounts of CR DNA, as shown in a plasmid pJCV-Mad1 DNA titration. Note that Ct values for amounts as low as 10−6 mol were obtained with fewer than 30 cycles. RFU, Relative fluorescent units. (b) ChIP was performed as described in Methods and in the legend to Fig. 3. Δ, No Tat; ◯, +Tat.

