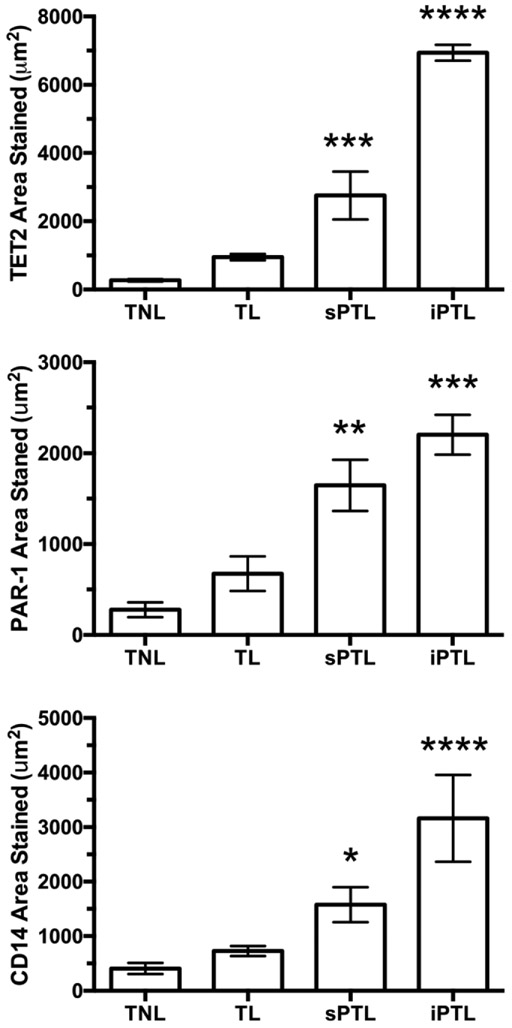
Figure 2.
Area of staining in decidual tissue for women who were TNL (n = 6), women who were TL (n = 5), women who were sPTL (n = 4), and women who were iPTL (n = 3). The areas of staining for TET2 and PAR-1 were small in women with TNL or TL. However, there was a marked and significant increase in the areas stained for both TET2 and PAR-1 in women with sPTL and an even greater increase in women with iPTL. The increase in areas stained for TET2 and PAR-1 correlated with the staining for macrophages, CD14. The Measuring Images tool in the cellSens software was used to determine the area of staining for statistical analysis. Data represent mean ± SE, * P < 0.05, ** P < 0.01, *** P < 0.001.

