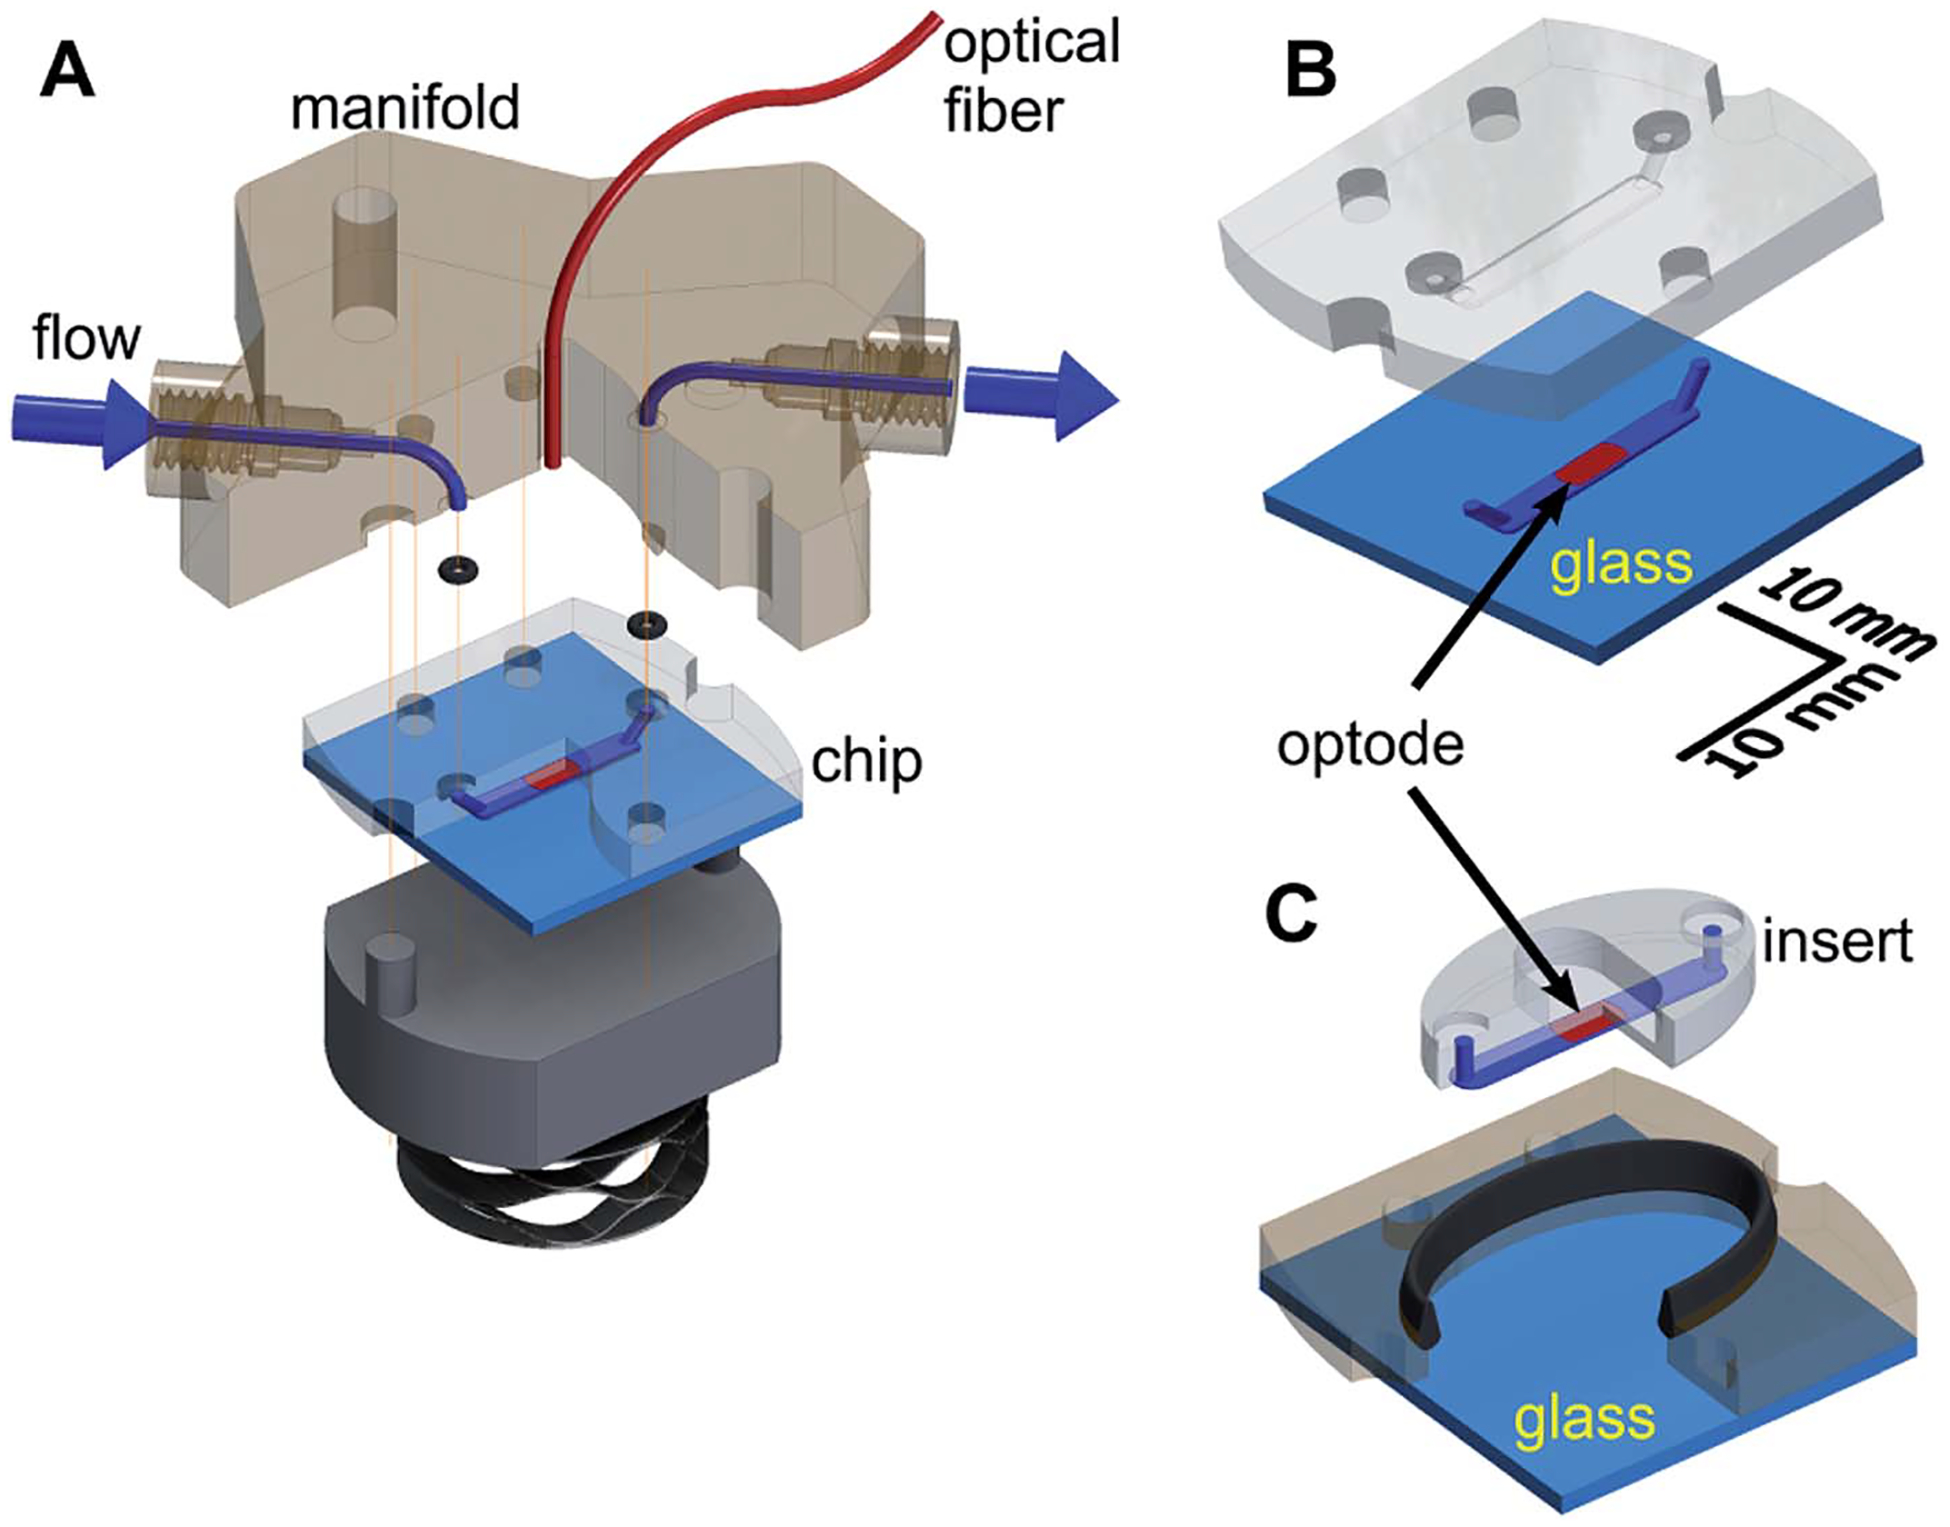
Fig. 1.

Schematic of the MfR for adherent and non-adherent samples. (A) An exploded view of MfR. Solution flow is shown in blue. Optical fiber and PS/PtOEP are shown in red. O-rings are shown in black. Vertical lines show alignment points. (B) Closed shell configuration for suspension measurements. A 3D-printed chip is fully adhered to glass (light blue). (C) Open shell configuration for adherent measurements. Integral seal is shown in black.
