Fig. 1.

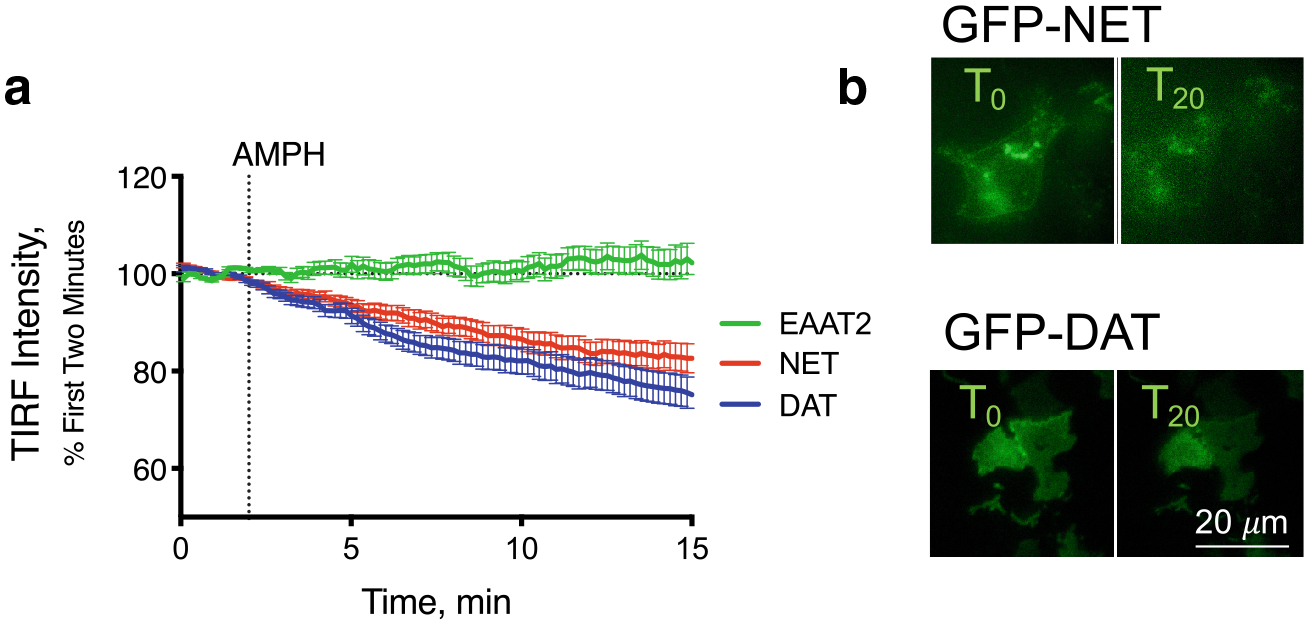
Internalization of DAT and NET in response to AMPH Membrane expression of GFP-tagged NET (red), DAT (blue) or the glutamate transporter, EAAT2 (green), were measured by total internal reflection fluorescence (TIRF) microscopy. After a 2-min baseline, AMPH (10 μM) was applied. Both NET and DAT internalized in response to AMPH while EAAT2 was unaffected (a). Representative images of HEK293 cells expressing GFP-tagged NET or DAT before and 20 min after AMPH application (b). Scale bar is 20 μm for all images
