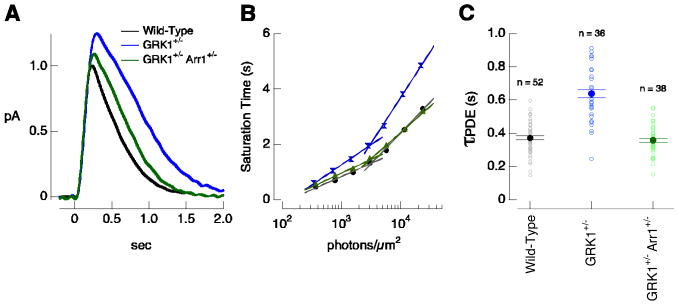
Figure 3.
Rh* inactivation depends on the relative concentration of arrestin1 and GRK1. (A) Mean estimated single-photon responses for wild-type (black), GRK1+/− (blue), and GRK1+/−Arr1+/− (green) rods at 30 ± 1°C. (B) Representative Pepperberg plot (time spent in saturation as a function of the log of flash intensity) for wild-type, GRK1+/−, and GRK1+/−Arr1+/− rods. PDE activity decay time constants (τPDE) were 420, 630, and 430 ms. (C) τPDE for populations of wild-type, GRK1+/− and GRK1+/−Arr1+/−rods at 30 ± 1°C. τPDE = 370 ± 10 ms for wild-type (mean ± SEM; n = 52); 640 ± 25 ms for GRK1+/− (n = 36); and 360 ± 10 ms for GRK1+/−Arr1+/− (n = 38).

