
Figure 4.
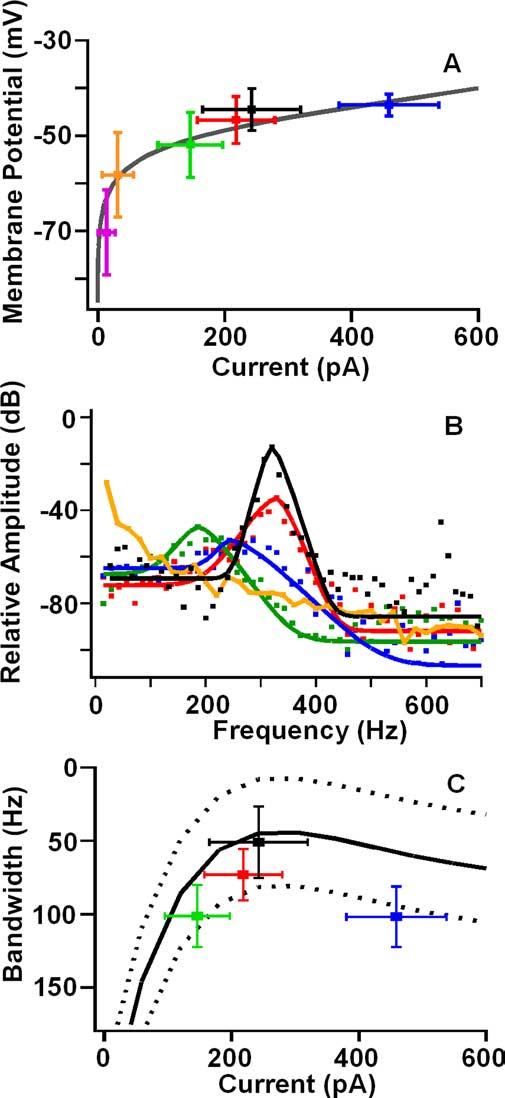
A, Resting potential as a function of inward current for different apical conditions. Colors are the same as Figure 3 showing steady-state MET for four apical [Ca2+] with free-standing bundles; purple is mechanical block of MET, and black is current injected to best resonant voltage.Gray curve is the BK activation curve in Figure 1, E and F,scaled to the maximum BK current. B, Points (squares) are the amplitude spectra of the baseline membrane potential for the four Ca2+ concentrations shown in Figure 3. Curves represent the least-squares fit of the roex filter functions to the amplitude spectra. Black represents response at the best resonant voltage. Response at 2.8 mm Ca2+ exhibitedalow-passresponse. C,Equivalent rectangular bandwidth of roex filters as a function of current at rest. Curve represents a polynomial fit (±SD) to the ERB when injecting current and mechanically blocking the MET (n = 6). Colors are the same as used previously, representing apical [Ca2+] and the response at the best resonant voltage (black). ERB for 50μm is smaller than those at 200μm (p < 0.0004) and 20μm (p < 0.00005). ERB at the best resonant voltage is smaller than that for each apical [Ca2+] (200 μm, p < 0.0025; 50 μm, p < 0.0002; 20 μm, p < 0.01; t test, pairwise). Q10 dB for the roex filters are as follows: 20 μm, 2.0 ± 1.1; 50 μm, 3.1 ± 0.8; 200 μm, 1.2 ± 0.9; DC, 4.5 ± 2.4.