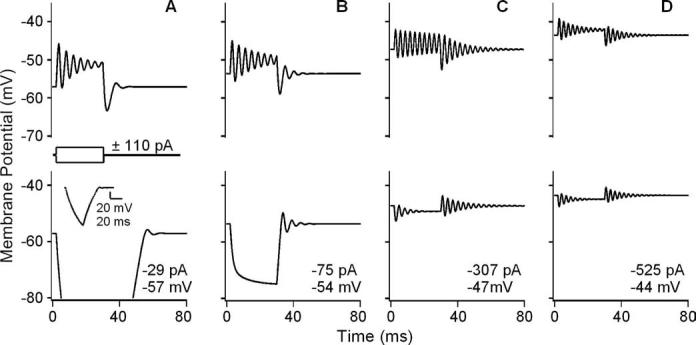
Figure 5.

Membrane potential calculated using a model of electrical resonance (Hudspeth and Lewis, 1988a, b).Responses are to ± 110 pA current steps and varying amounts of MET (leak) current (A–D; leak values shown in each panel with the resting potential). The responses simulate the following conditions: A, 2.8 mm Ca2+; B, 200μm Ca2+; C,50 μm Ca2+; D, 20 μm Ca2+ (Fig. 3). Inset in bottom of A shows complete passive response to negative step, which extends off-scale. Spectral filtering is sharpest for simulation of 50 μm Ca2+ condition in C. ERBs of electrical resonance during the depolarizing step are as follows: A, 99 Hz; B, 71 Hz; C, 54 Hz; D, 82 Hz.
