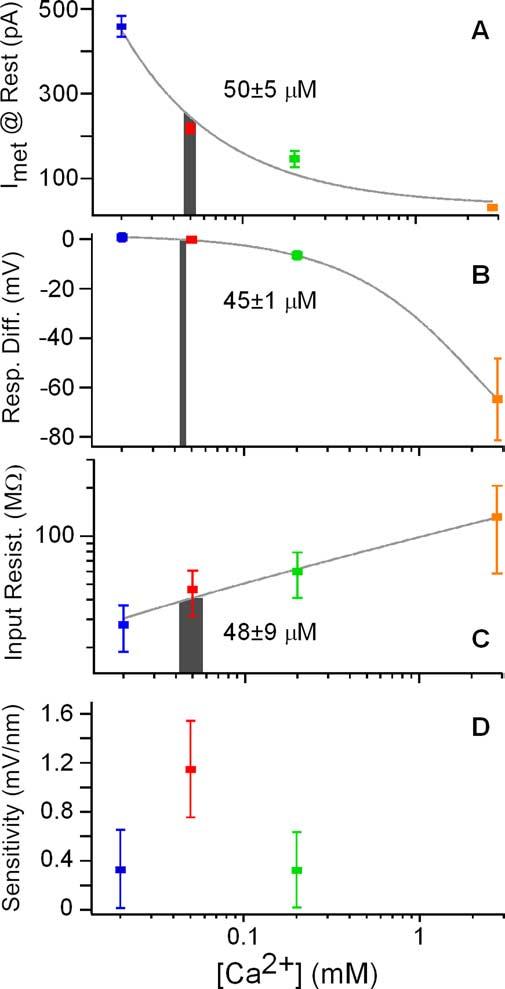
Figure 7.

Characteristics of electrical resonance as a function of apical [Ca 2+]. A–C, Gray curves are polynomial fits to the data. Gray bars represent interpolation of the endolymphatic [Ca 2+] from the control condition at the best resonant voltage. Bar widths are generated from interpolation of the mean ± SE for each y-axis variable at the best resonant voltage: A, steady-state current; B, membrane response difference to positive and negative current; C, input resistance.D, Membrane sensitivity (±SE) to mechanical input at the resonant frequency calculated as the product of the linear slope of the current – displacement curves near 0 displacement (Fig. 2 D, E), the input resistance for positive current injections, and the Q10 dB of the roex filters.
