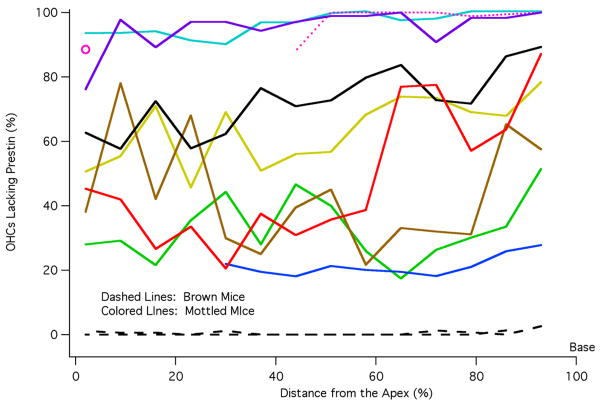
Figure 5.
Cochleograms. Percent OHCs lacking prestin is plotted as a function of distance from the apex of the cochlea. The average number of unstained/missing cells is computed for each 7% segment. Cochleograms for brown mice are plotted with dashed lines. Data for mottled mice are represented with solid, colored lines except for the one mouse plotted with pink dotted lines to indicate that data are missing in the apex. Although the data plotted represent the average percent of OHCs lacking prestin for all rows, it should be stated that there was only one instance where a statistically significant difference existed between rows of OHCs. This occurred in one mottled mouse and for only the most basal 7% section. The color code used for mottled mice is maintained in Figs. 7B, 8 and 9.

