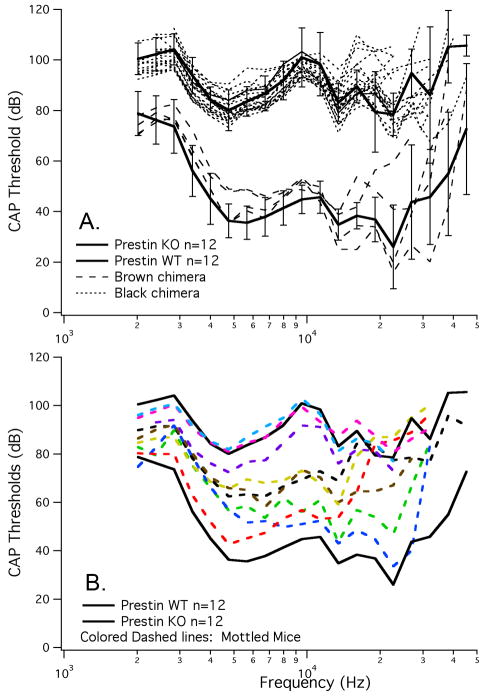
Figure 7.
CAP thresholds for chimeric mice. Mice of a single coat color appeared as WT when brown (dashed lines) or KO (dotted lines) when black. For comparison, mean and standard deviations for WT and prestin KO mice are appended. CAP thresholds in mottled mice are provided in panel B. Animals with a variegated coat color (colored dashed lines) exhibited an intermediate phenotype that spanned the range between WT and KO sensitivities. The more brown in coat color the more WT in phenotype.

