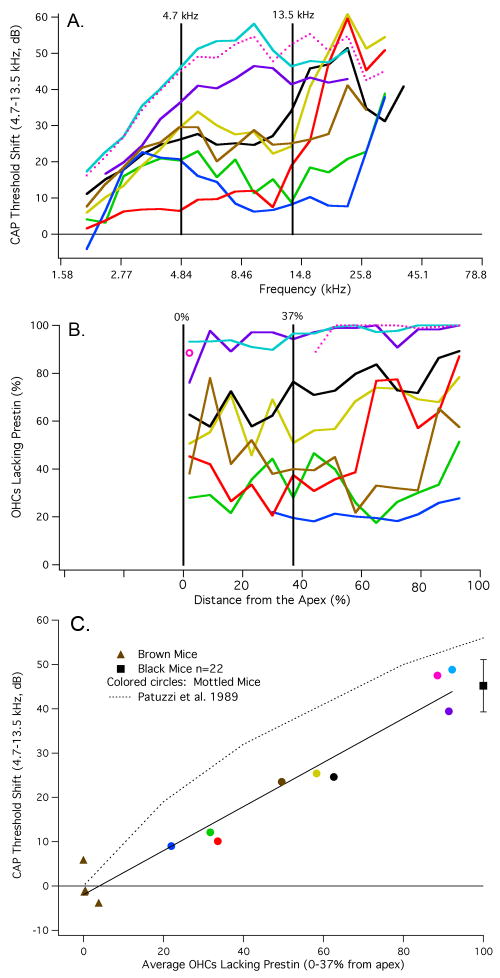
Figure 9.
CAP threshold shifts (panel A) and cochleograms (panel B). By using the mouse frequency/place map of Müller et al. (2005), the physiological and anatomical data were plotted on the same abscissa to correlate changes in prestin expression with changes in sensitivity. It should be noted, however, that CAP responses below ∼4.5 kHz are produced by single units with characteristic frequencies greater than the stimulus frequency. In other words, these nerve fibers are responding on the tails of their tuning curves. Average threshold shift and average percent OHCs lacking prestin are computed for frequencies and distances indicated by the vertical lines. The cochleogram plotted with the pink dotted line indicates missing tissue due to dissection artifact. In this case, basal counts are available, as well as for the last apical segment, which appears as an isolated open circle. The CAP threshold shift for this mouse is also plotted with a dotted line. The relationship between CAP threshold shift and percent OHCs lacking prestin is provided in panel C. In this figure, the average CAP threshold shift for frequencies between 4.7 and 13.5 kHz is plotted as a function of percent OHCs lacking prestin. It should also be stated that the same result was obtained when the average CAP threshold was extended to 16.5 kHz. However, we decided to use the narrower range because CAP threshold shifts increase rapidly above 13.5 kHz in some mottled mice, i.e., the threshold shift did not remain flat. Data for brown mice appear as triangles, those for mottled mice as colored circles. The mean (+/- one standard deviation) for black mice appears as a square. The predicted change of gain estimated by Patuzzi et al. (1989, Fig. 3) is appended for reference.

