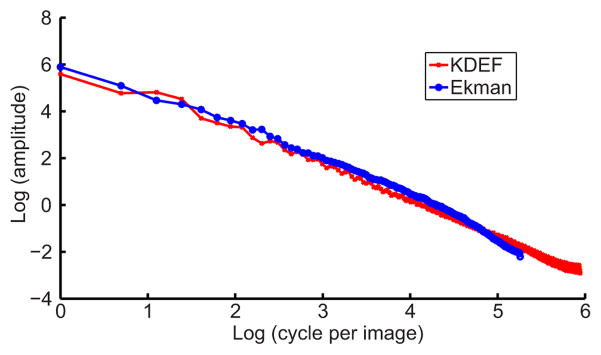
Figure 8.
Correlation statistics of front-view real-face images measured by the Fourier amplitude spectrum of the KDEF database (red) and Ekman database (blue). The log-log plots show nearly straight lines indicating 1/fk relationship between amplitude and spatial frequency. The KDEF curve extends to higher frequencies because of the larger image size. Curve fitting yields k values of 1.61 for the KDEF faces and 1.65 for Ekman faces, with an average of 1.63.

