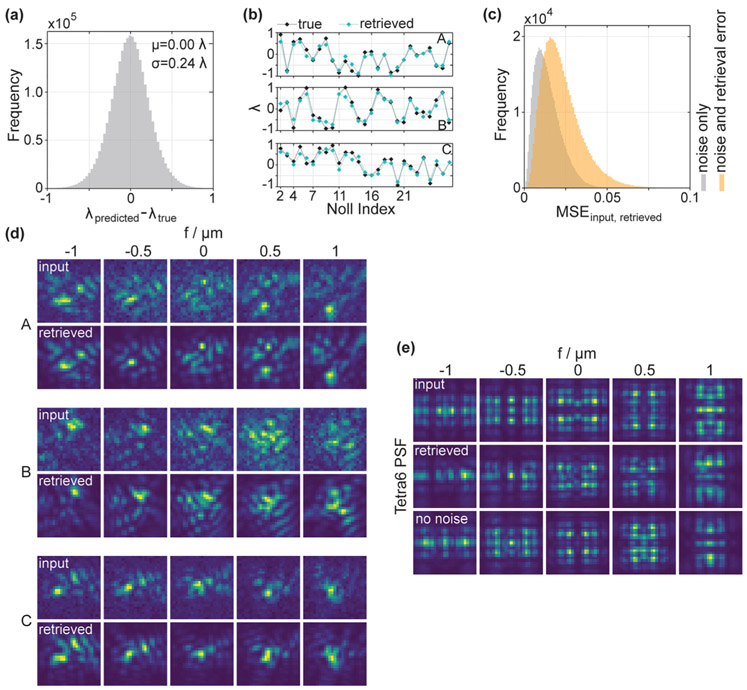
FIG. 3.
(a) Histogram of the differences in wavelength units between the retrieved and the ground truth values for all Zernike coefficients in the validation dataset. (b) Representative examples for the agreement between retrieved and ground truth Zernike coefficients for three PSFs. Notably, the prediction is accurate over the whole range of Zernike coefficients, up to the highest order. (c) Histogram of mean squared errors between input and retrieved PSFs, calculated pixelwise for each PSF slice of the 100 000 validation PSFs (orange). Input and retrieved PSFs are normalized. The high agreement between the retrieved and true Zernike coefficients translates to low MSEs. A significant fraction of the error stems from Poisson noise in the input PSFs, evident from the MSE between input PSFs without noise and input PSFs that include noise (gray histogram—“noise only” refers to the influence of Poisson noise in the input PSFs). (d) Comparison between the input PSFs at the five simulated focal positions and the PSFs generated from the retrieved Zernike coefficients, corresponding to the data plotted in (b). The agreement is very good. Note that the retrieved PSFs do not include background or Poisson noise, whereas the input PSFs to be retrieved do. (e) PR of the Tetrapod PSF with the 6 μm range (Tetra6). Retrieval results from an additional NN are included, which was trained on PSFs not including noise (no noise). Note in this case, the input PSFs do not include noise as would typically be the case for a specific phase mask design. The retrieved PSF approaches the ground truth well. As expected, the NN that was trained on PSFs without noise performs slightly better.

