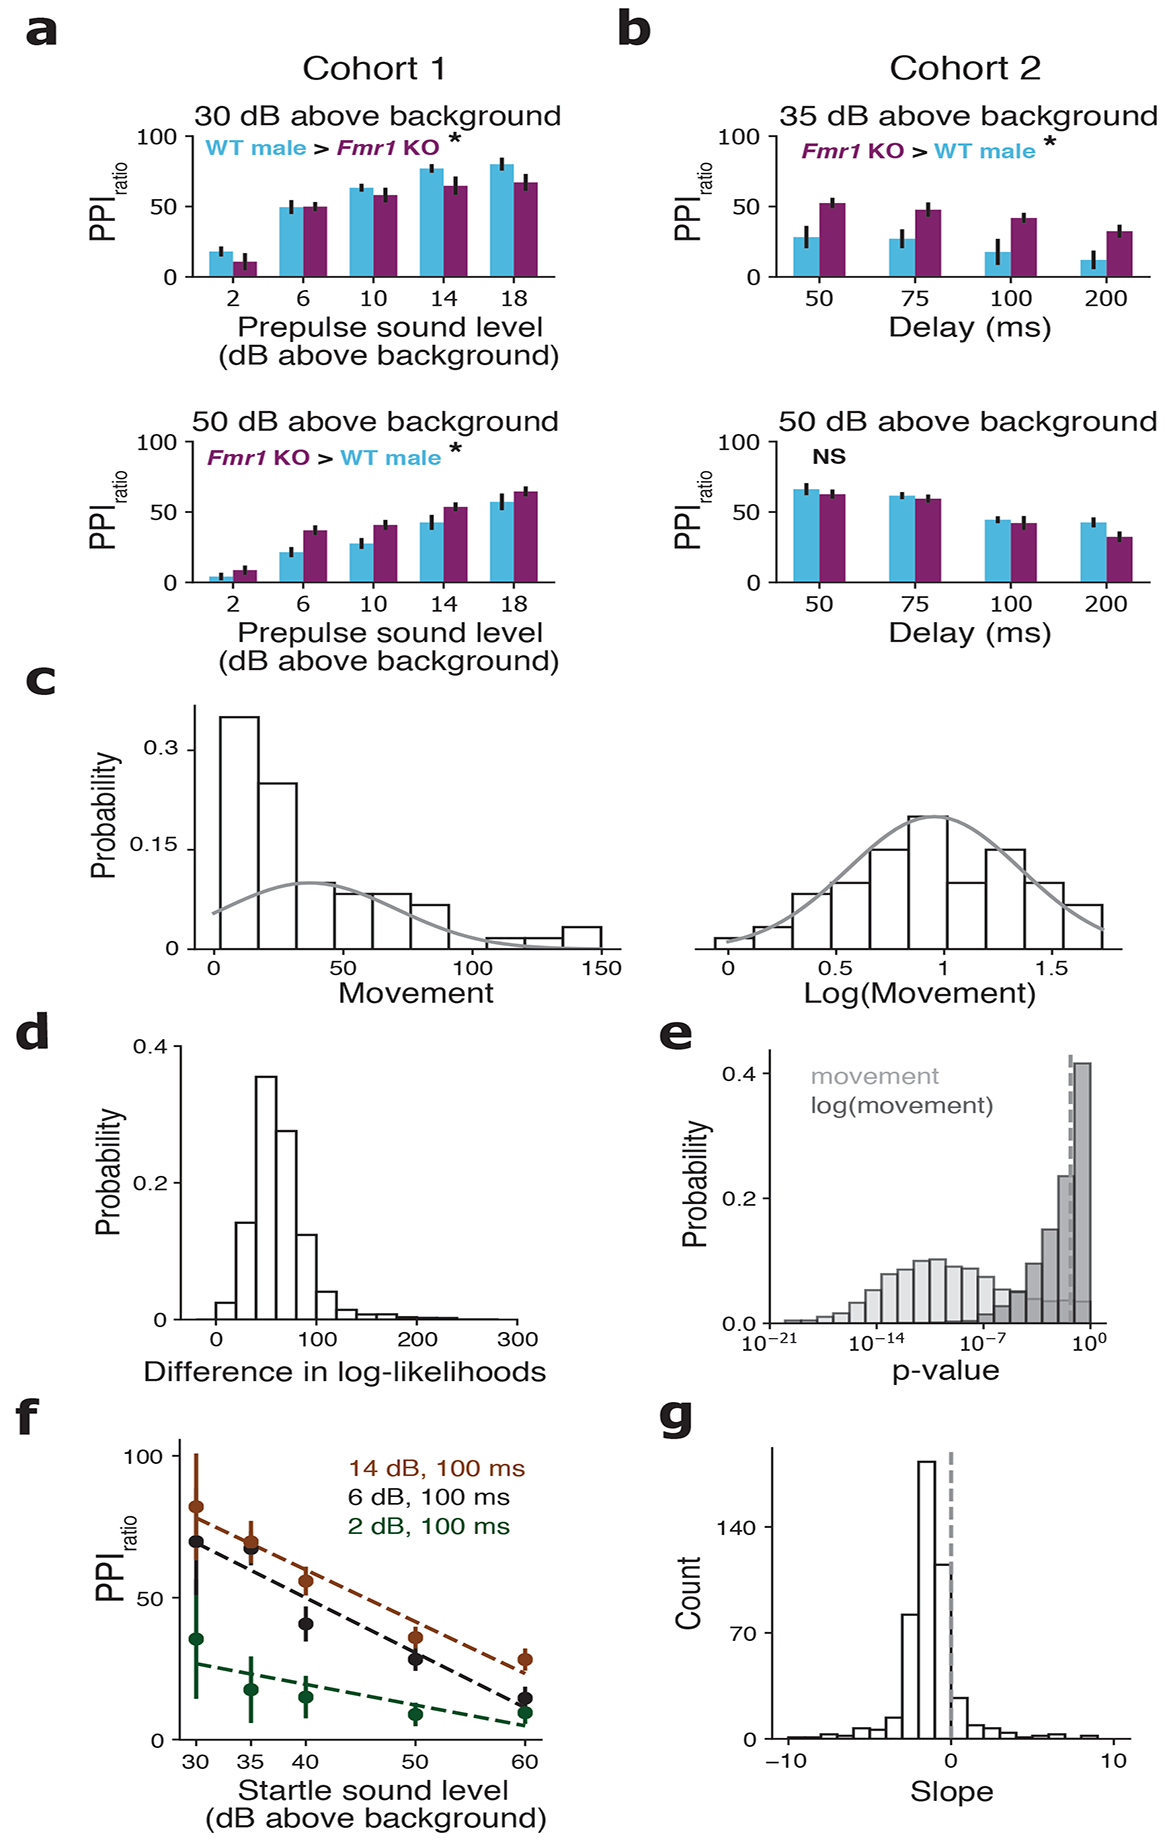
Figure 1.

Inconsistencies in standard PPIratio measurement. (a) PPIratio from the first Fmr1 cohort of male rats. Blue: WT (n = 7) and red: Fmr1 KO (n = 9) across different prepulse sounds with a constant 100 ms delay and startle sounds of 30 dB above background (top) or 50 dB above background (bottom). (b) PPIratio from the second Fmr1 cohort of male rats. Blue: WT (n = 9) and red: Fmr1 KO (n = 9) across different delays with a constant prepulse of 14 dB above background and startle sounds of 35 dB above background (top) or 50 dB above background (bottom). For a & b, significant group differences, indicated by an asterisk, were defined as a two-way ANOVA with p < 0.05. See supplementary methods for further PPIratio analysis on these data. (c) Example probability distribution of gain-normalized movement (see Fig. S2) (left) and log10 of gain-normalized movement (right) for one rat to a startle sound of 40 dB above background with no prepulse. Solid curves are Gaussian functions with mean and standard deviation equal to those of the data and height equal to the height of the bin containing the mean. (d) Distribution of the differences in log-likelihood of the movement data under a log-normal distribution and the log-likelihood of the movement data under a Gaussian distribution across all rats and stimuli. Positive value indicates that the log-normal distribution had a larger log-likelihood. (e) Distribution of Shapiro-Wilks normality test p-values across all rats and stimuli for the data before log-transformation (light grey) and after log-transformation (dark grey). Dotted vertical line shows p = 0.05. Smaller p-values indicate greater probability of rejecting the null hypothesis that the data is drawn from a Gaussian distribution. (f) PPIratio using log-transformed movement data for one rat (same rat as Fig. 1c) across five different startle sound levels (x-axis), three different prepulse sounds (colors), and a constant 100 ms delay. Bars show the standard error of the mean. Dotted lines show linear regressions for each prepulse sound level. (g) Distribution of linear regression slopes of PPIratio versus startle sound level (dotted lines in Fig. 1f) across all rats and stimuli. Dotted line shows slope of 0.
