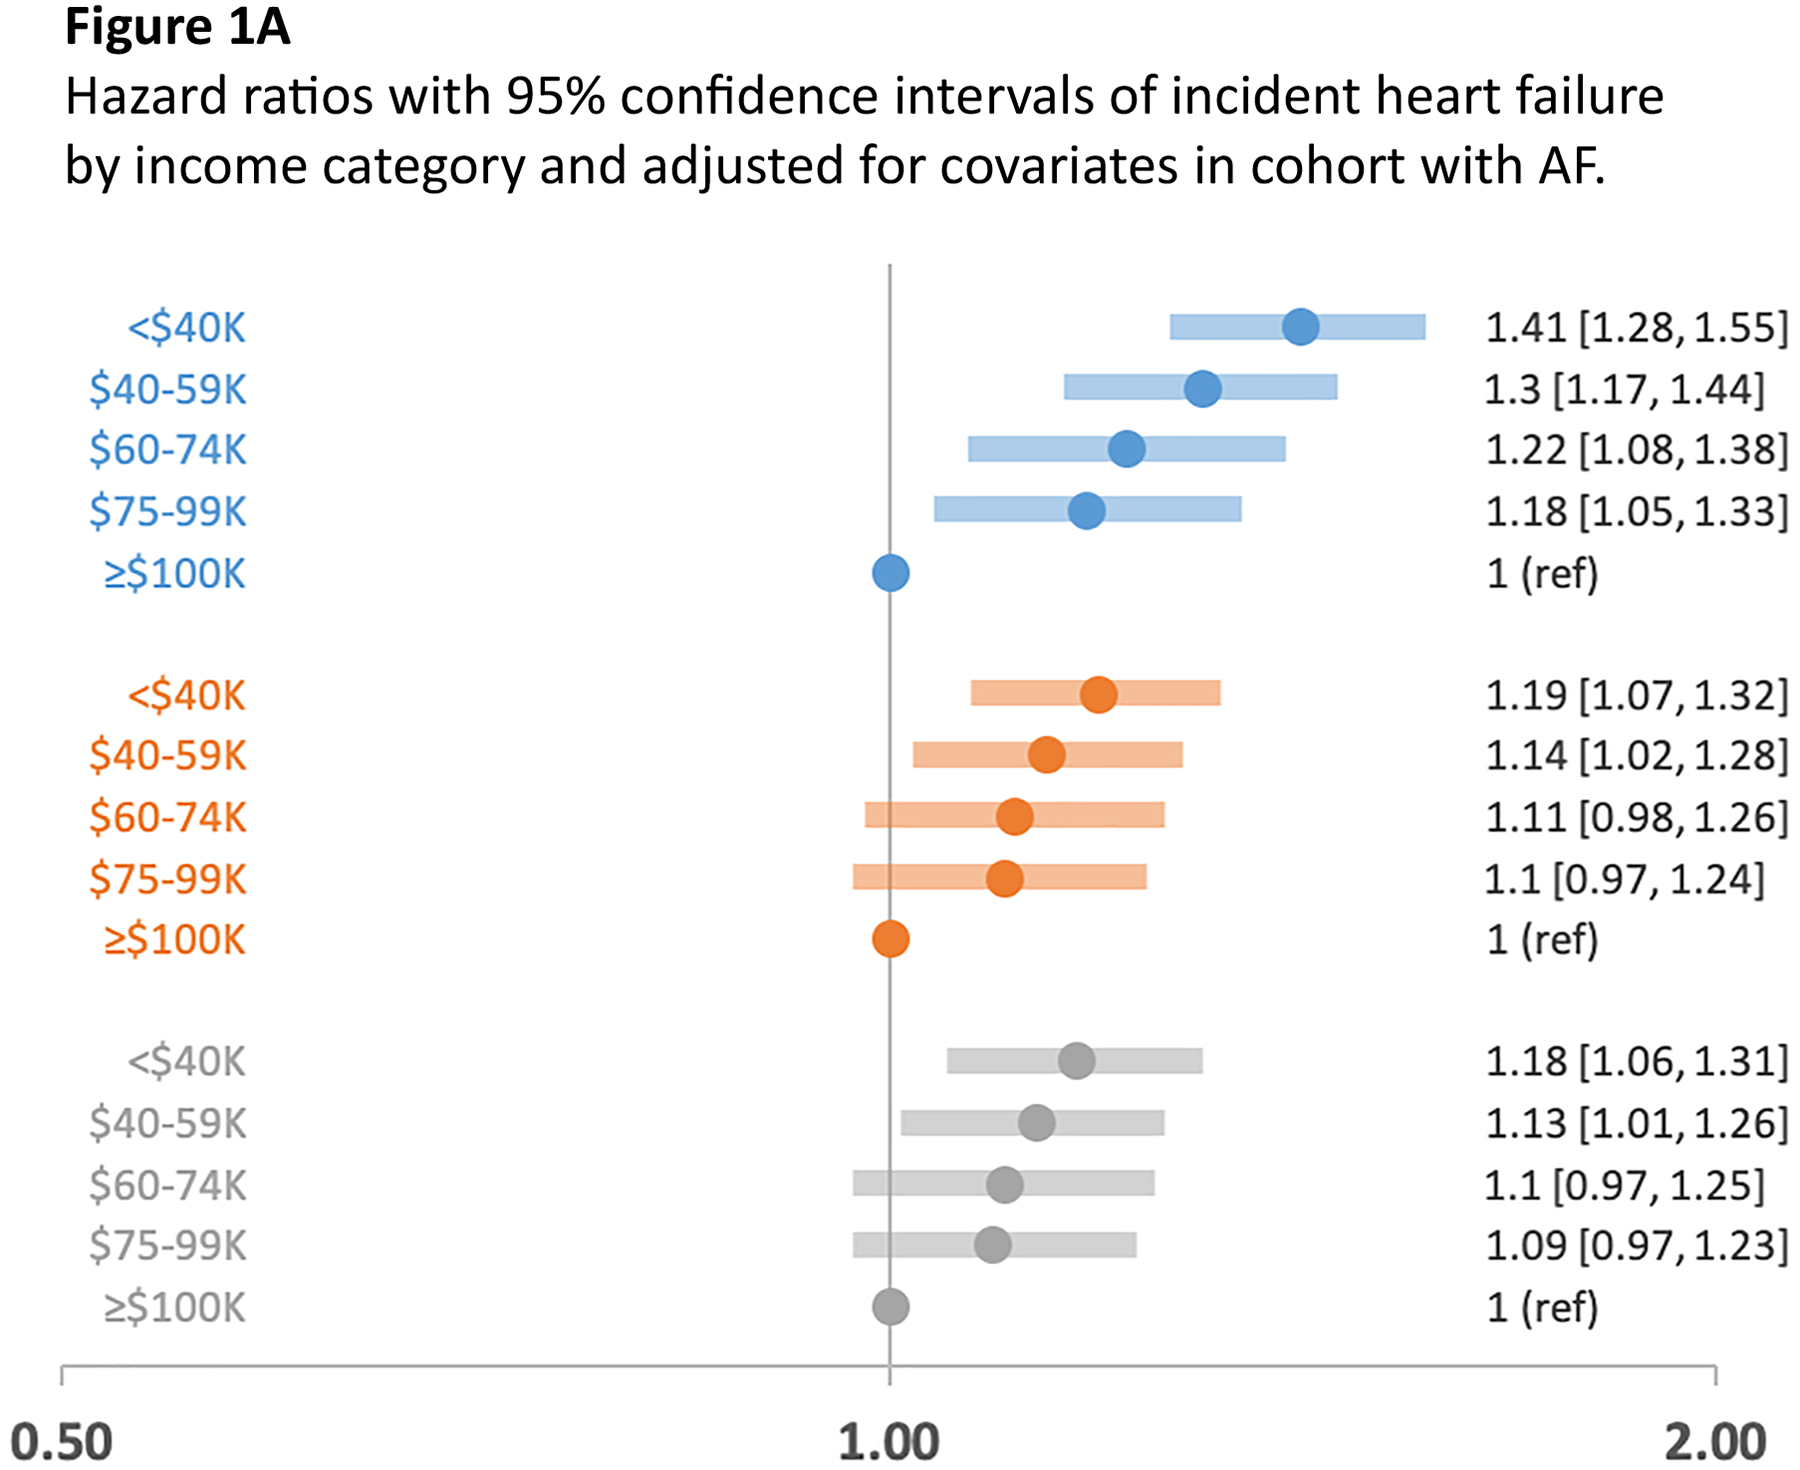
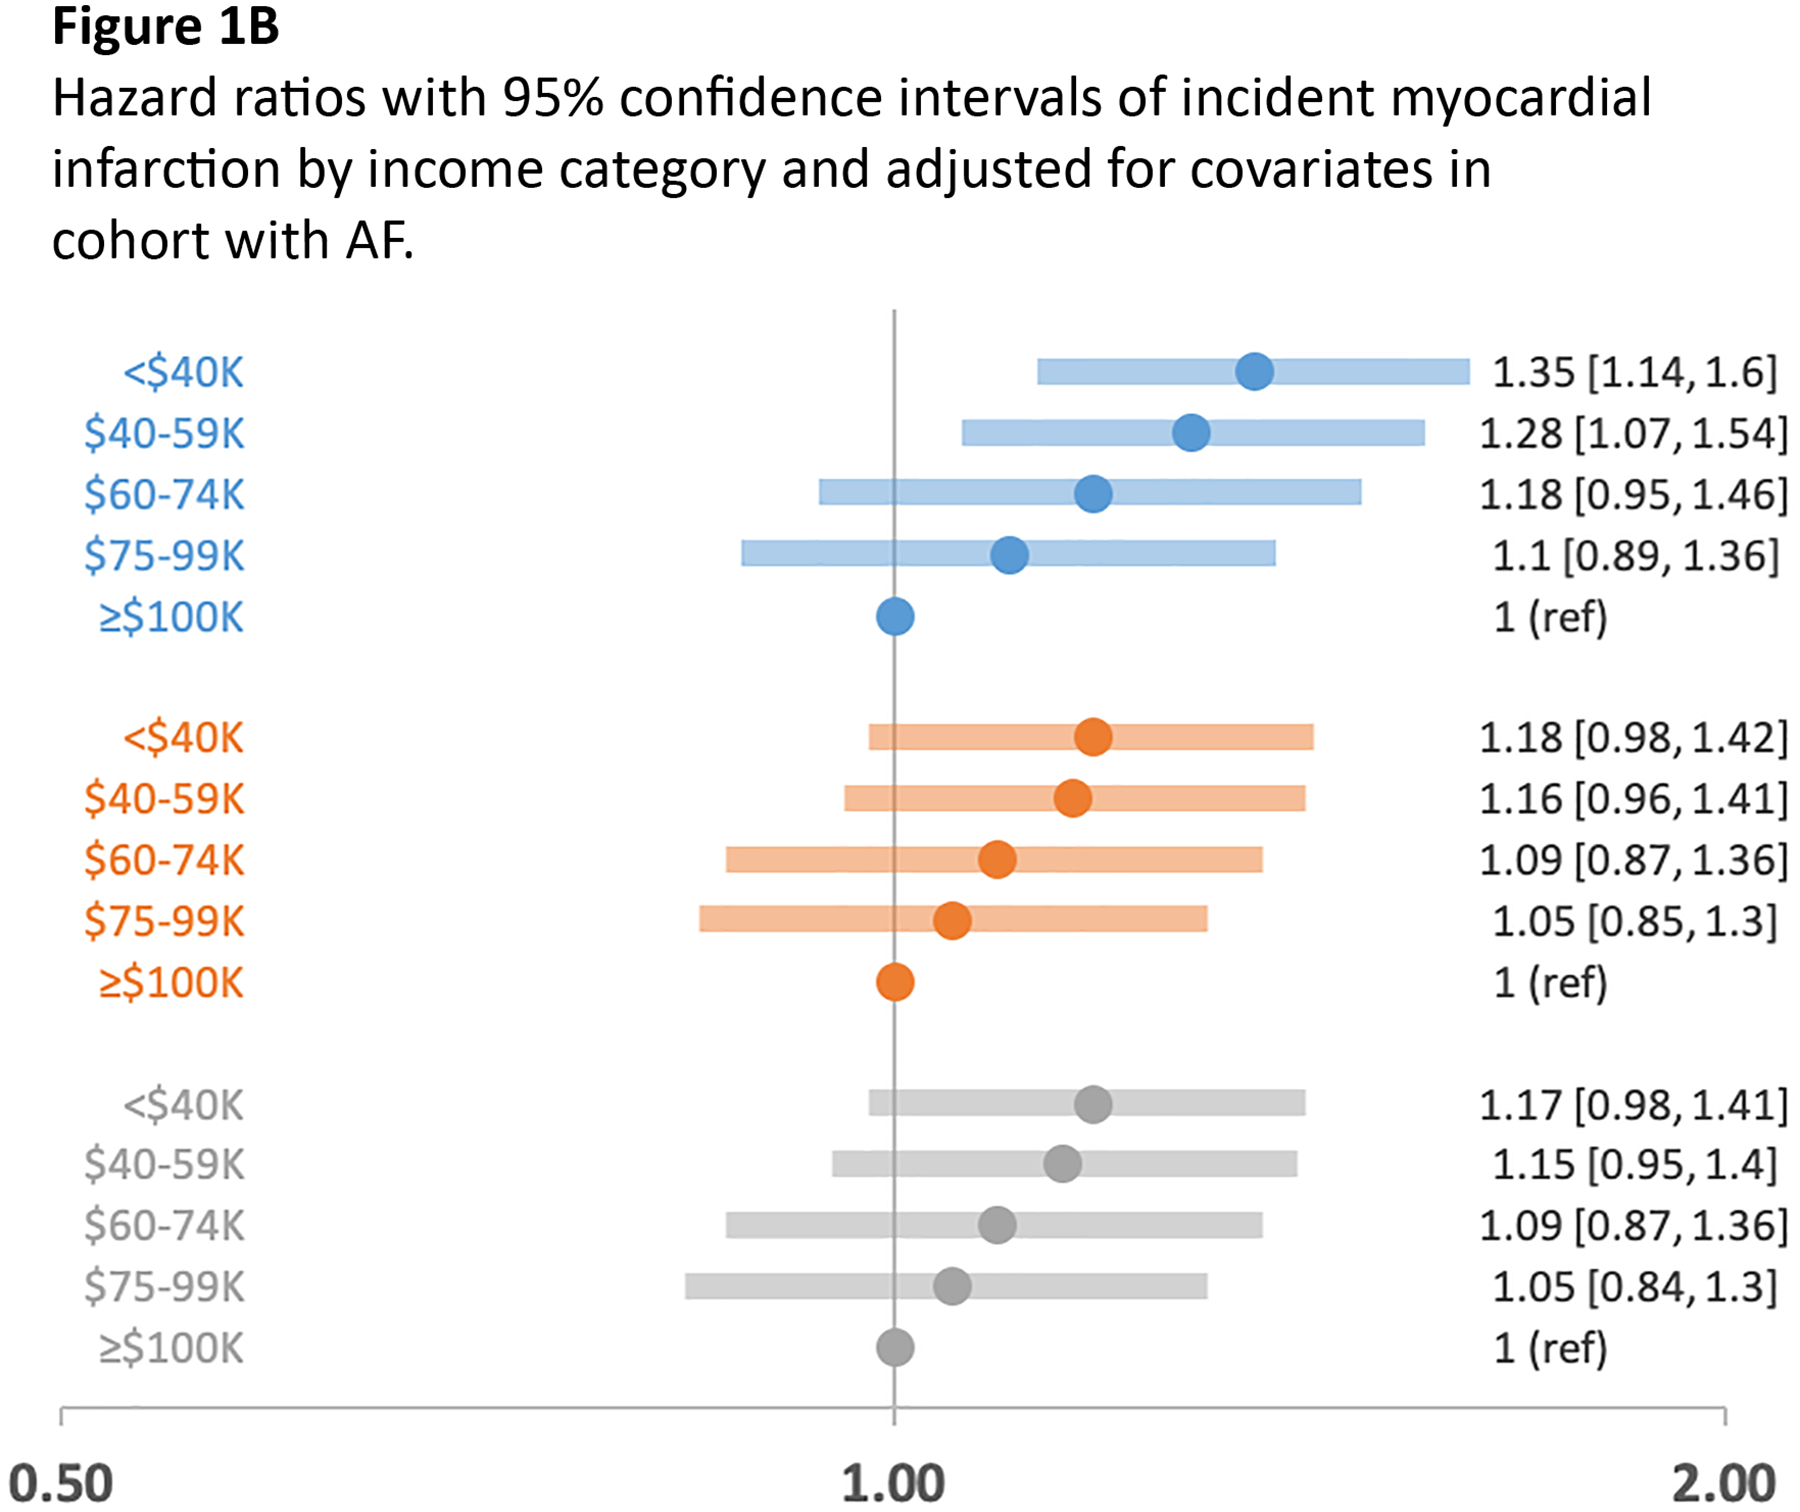
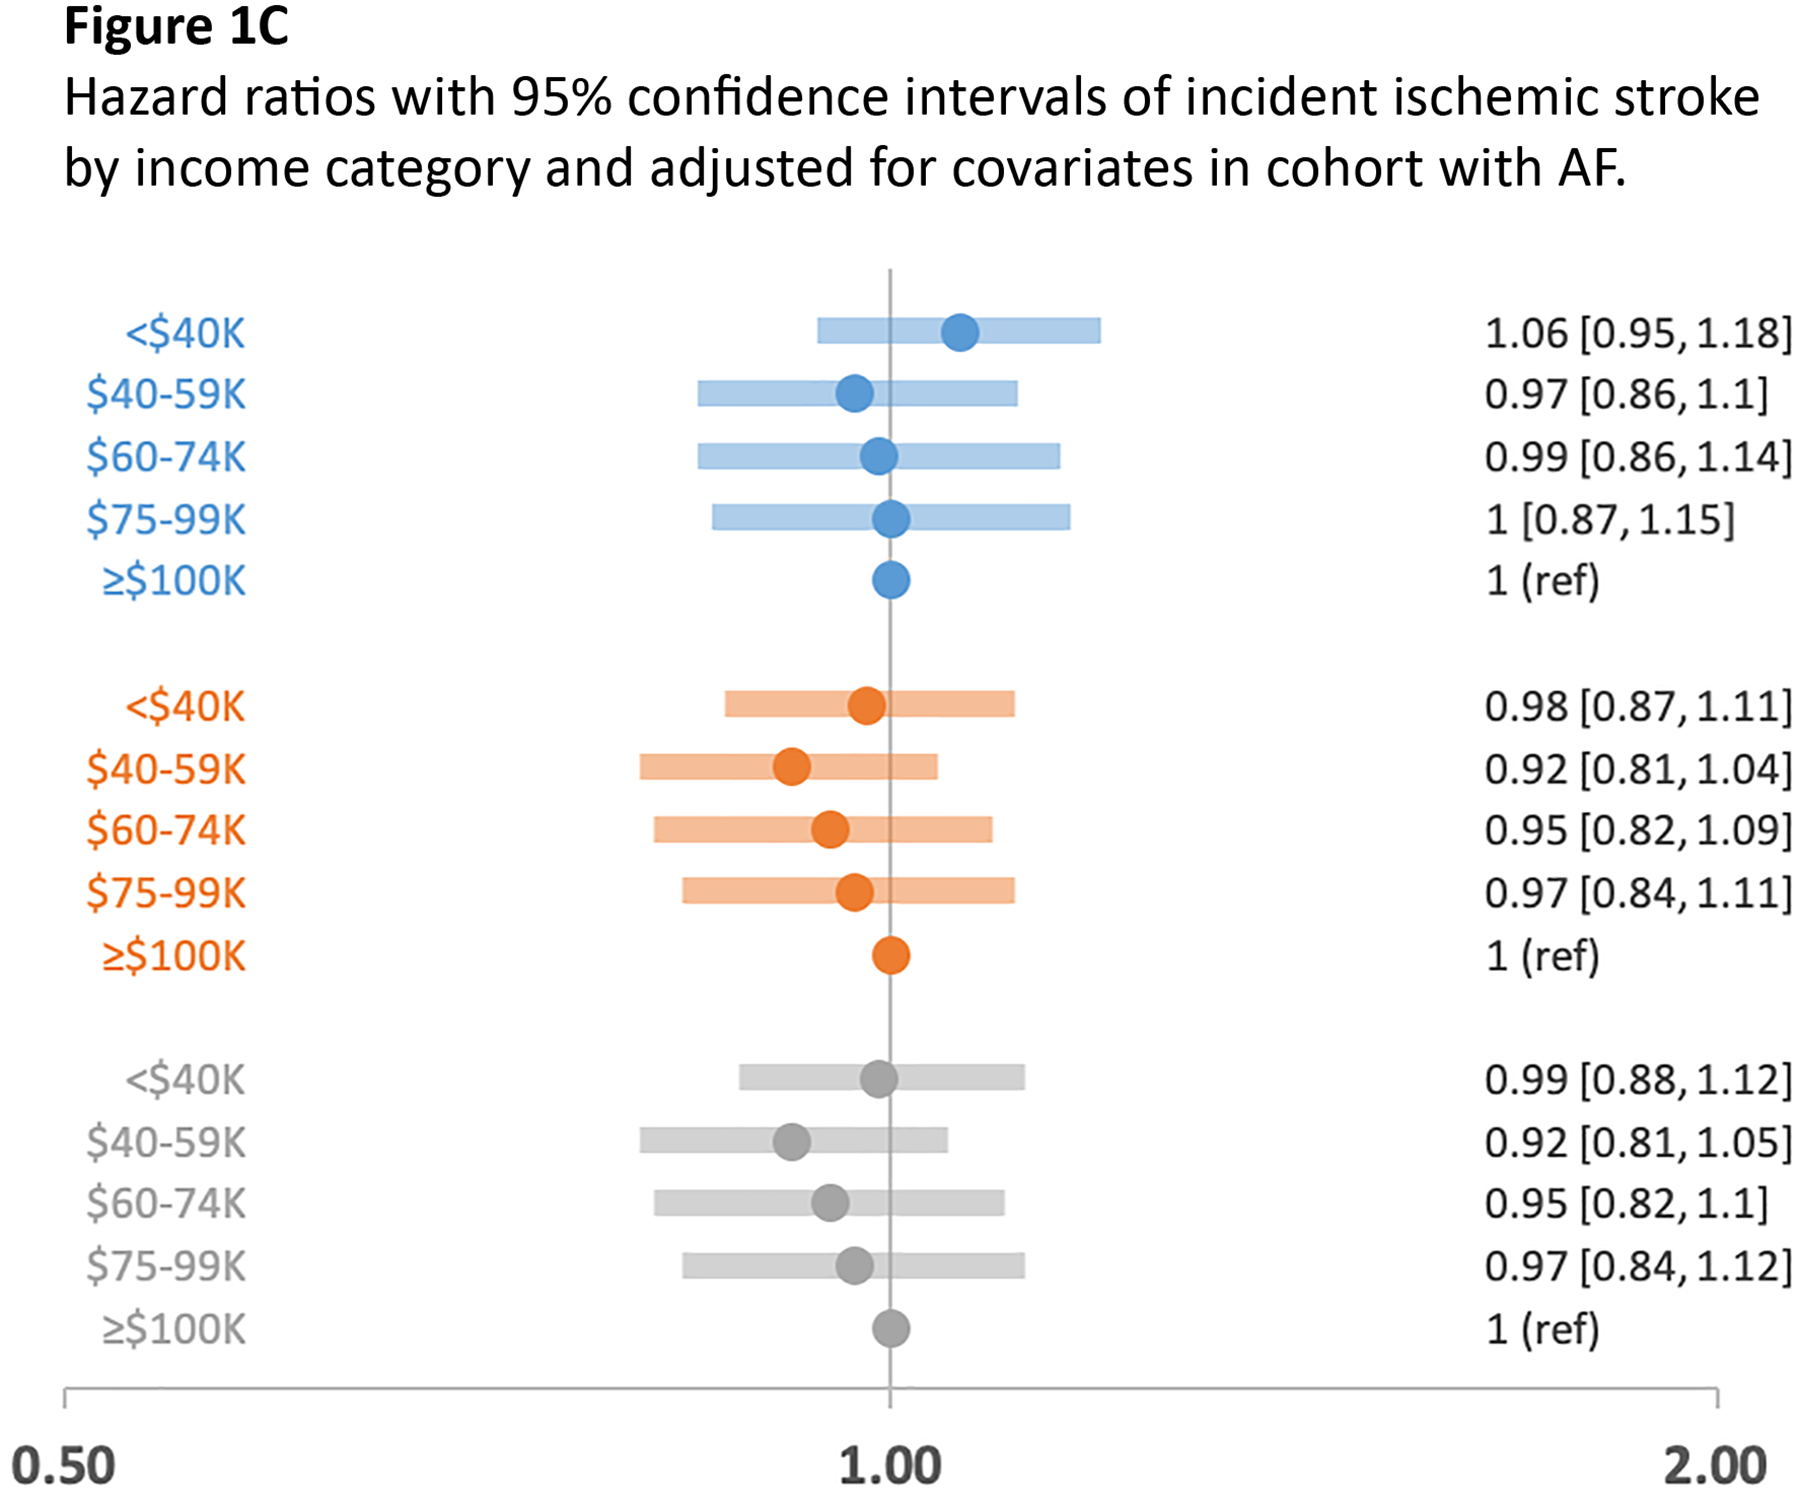
Figures 1A, 1B, 1C. Hazard ratios with 95% confidence intervals of incident heart failure, myocardial infarction, and ischemic stroke by income category and adjusted for covariates in cohort with AF.


Figures 1A, 1B, and 1C are forest plots of multivariable-adjusted hazard ratios with 95% confidence intervals of incident cardiovascular outcomes heart failure, myocardial infarction, and ischemic stroke by income category. Incident event rates were calculated and related to income in multivariable-adjusted Cox proportional hazard models that compared risk by income category with income >$100,000 as referent. Model 1, adjusted for age, sex, and race; Model 2, adjusted for age, sex, race, education, hypertension, diabetes, prevalent coronary heart disease, and prevalent heart failure; Model 3, adjusted for age, sex, race, education, hypertension, diabetes, prevalent coronary heart disease, prevalent heart failure, chronic obstructive coronary disease, chronic kidney disease, and oral anticoagulant use. Figure 1A, heart failure by income category; Figure 1B, myocardial infarction by income category; Figure 1C, ischemic stroke by income category adjusted for the 3 models.
