Fig. 4.

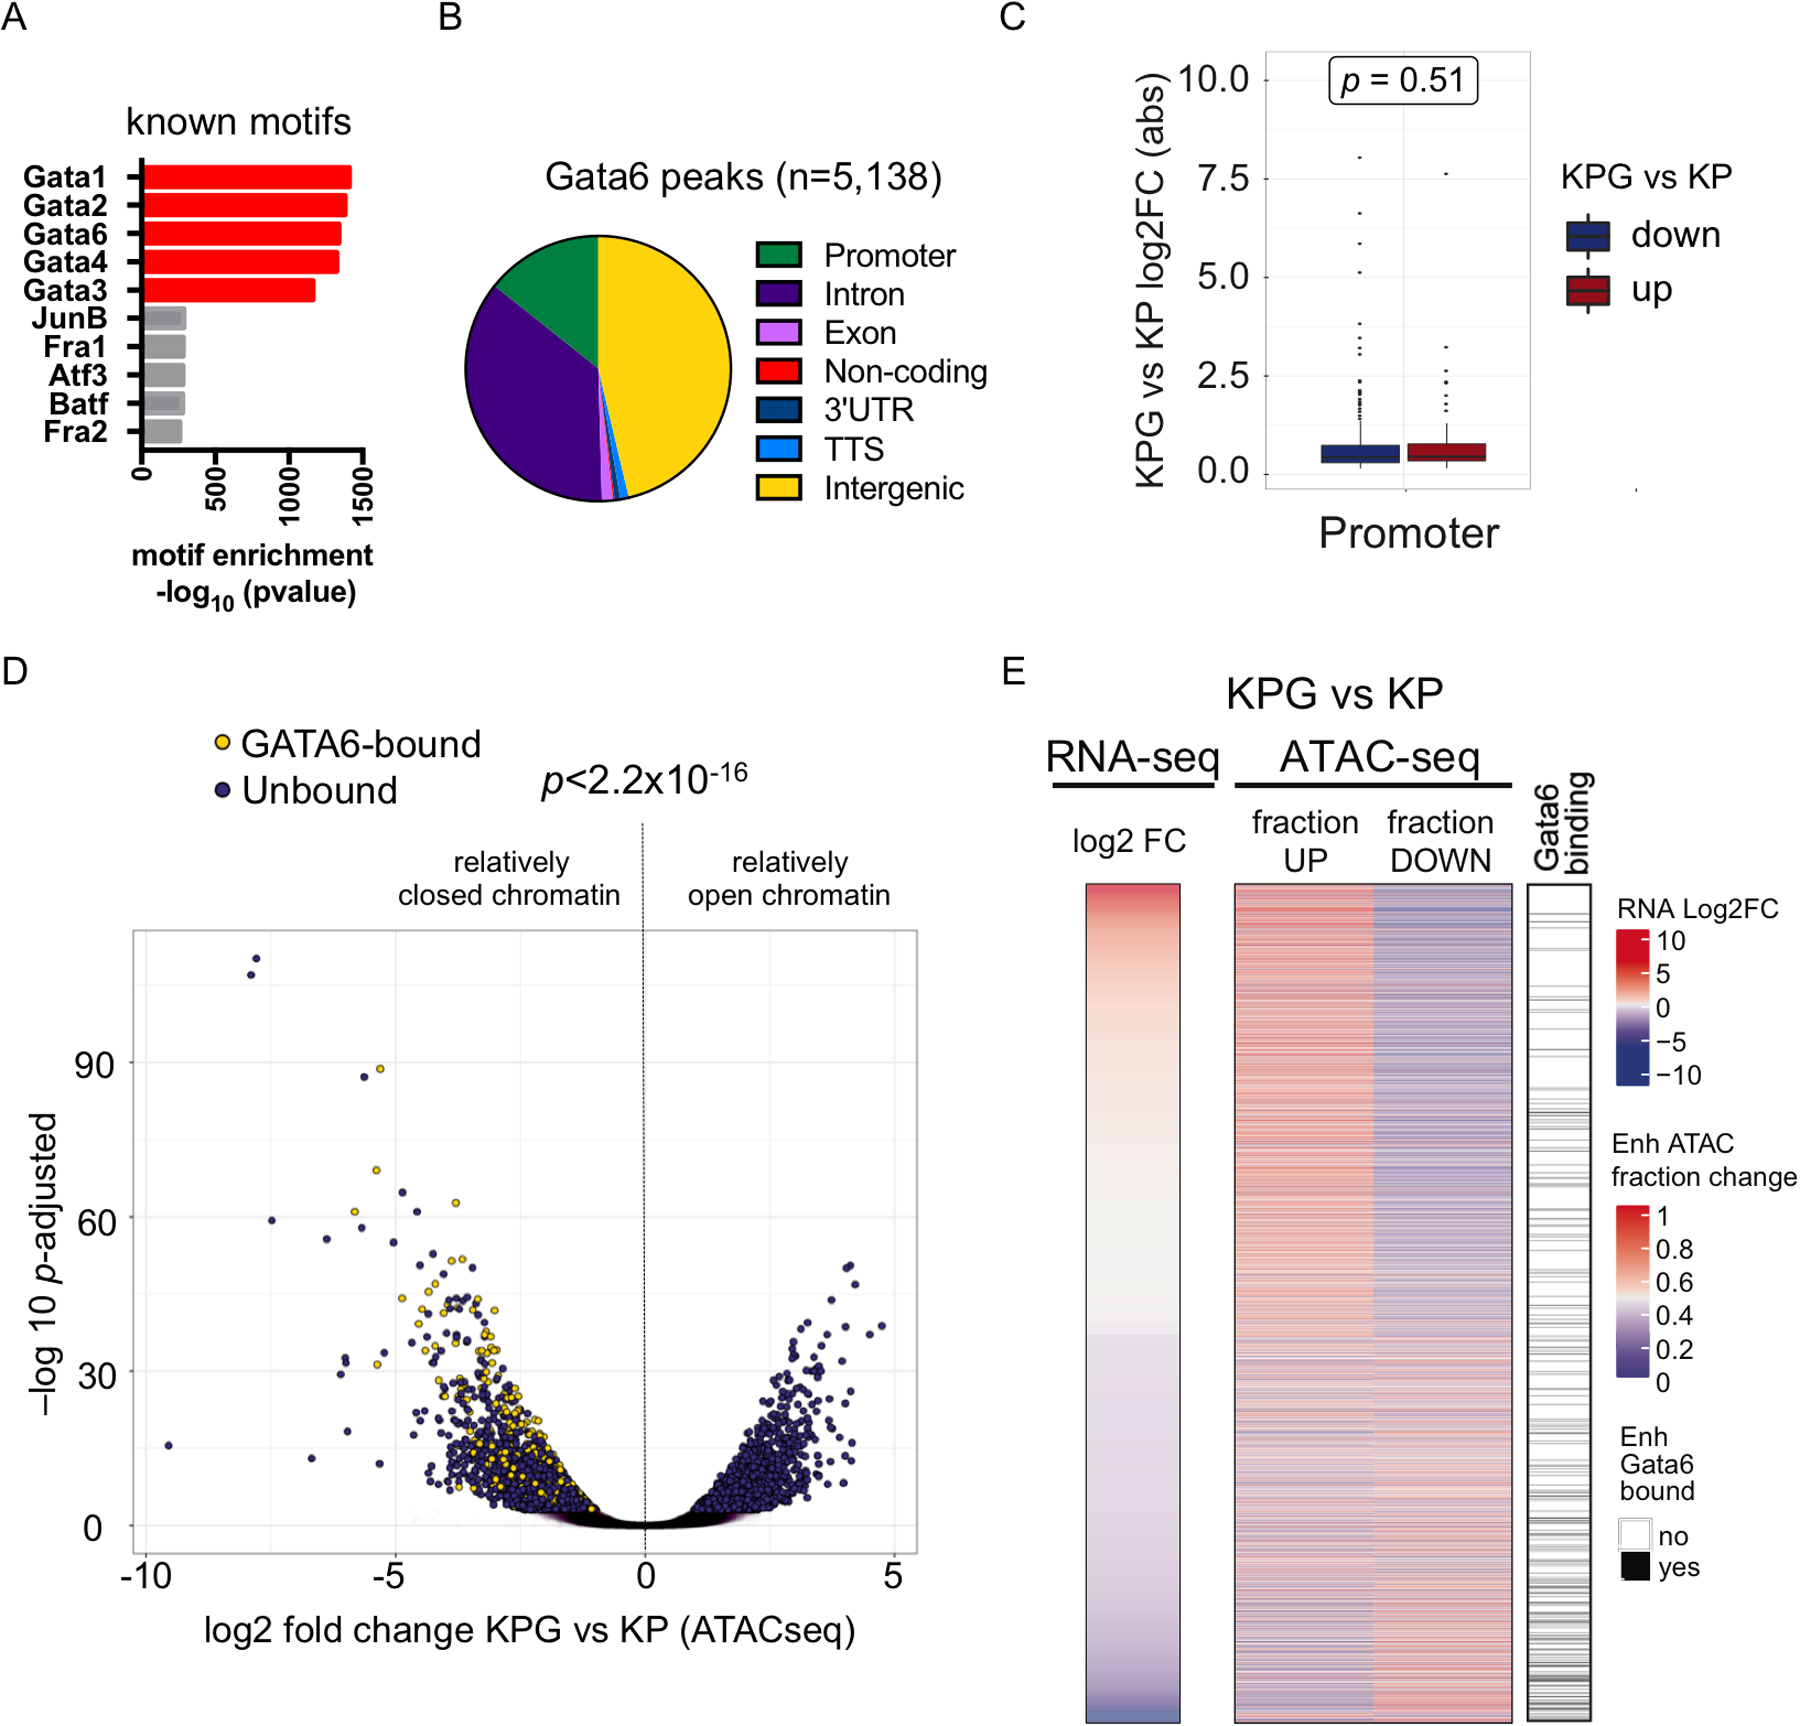
The GATA6 dependent chromatin and epigenomic landscape of LUAD cells. a Transcription factor (TF) binding motif analysis for GATA6 ChIP-seq peaks in KP tumor. b Annotation of the genomic loci overlapping with GATA6 peaks. Promoter = 0–2Kb upstream and downstream of transcription start site (TSS). c Box plot of absolute log2 fold change of genes differentially expressed in KPG vs KP cells with GATA6 bound at their promoters. No bias was detected between activated (red) or repressed (blue) genes. P-value was calculated by Mann Whitney test. d Volcano plot of significant ATAC peaks with annotation of GATA6 binding (bound, yellow; unbound, purple). P-value was calculated by Chi-Square. e Heatmap of differential gene expression, chromatin accessibility, and GATA6 binding in putative enhancers (defined as H3K27ac peaks within 100Kb of TSS). Left: each row is a gene that is differentially expressed in KPG versus KP cells. Middle: for each gene, ATAC peaks within 100Kb of their TSS were determined, and the fraction of newly open (up) or closed (down) regions in KPG cells is plotted. Right: GATA6 binding (black) is based on whether one or more GATA6 ChIP-seq peaks overlap with significantly changed ATAC peaks within the same region in KP cells.
