
FIGURE 3. Quantitative discovery of the Parkin-dependent ubiquitylome in iNeurons during mitophagic signaling.
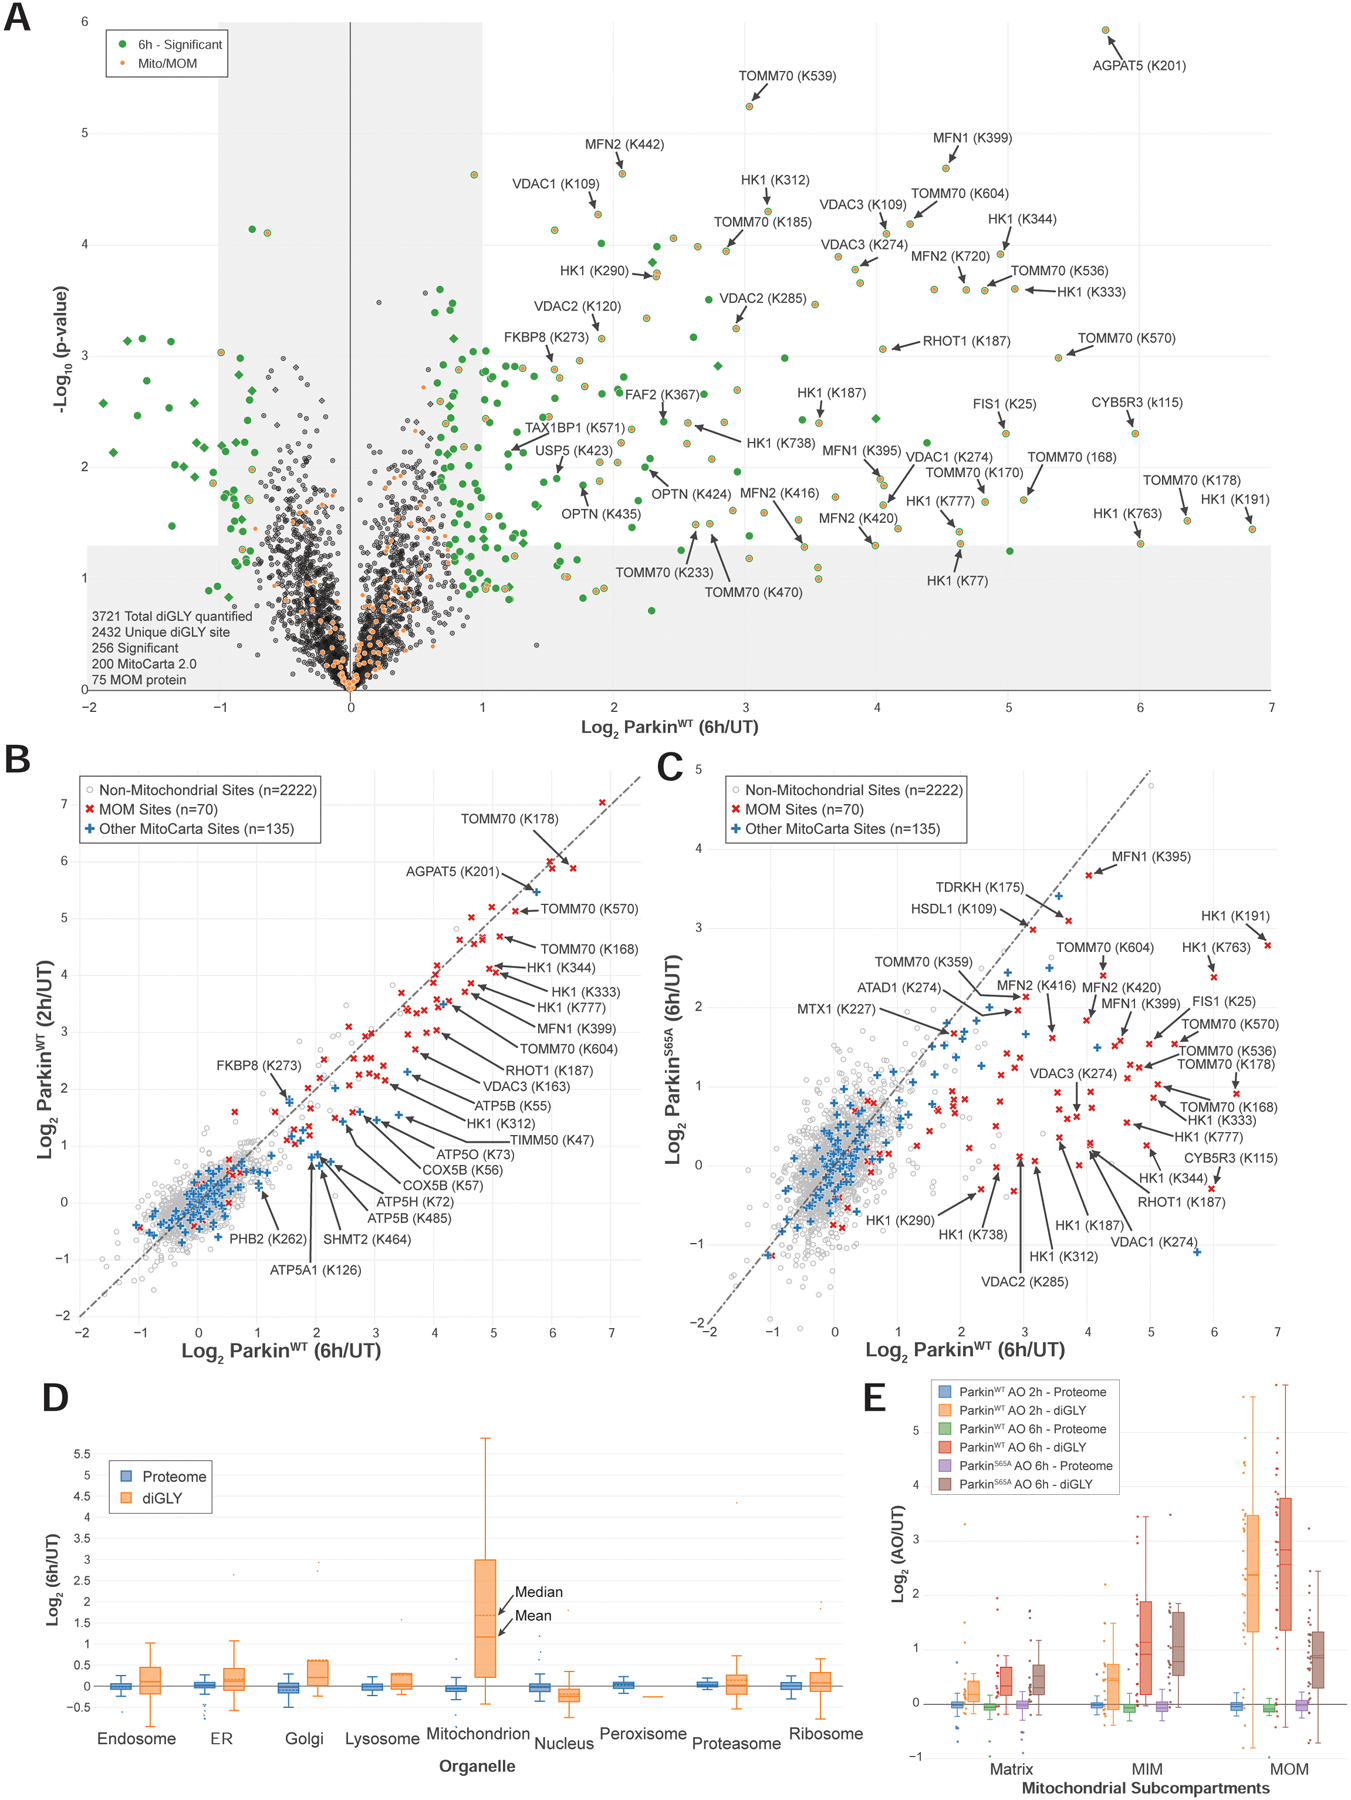
(A) Volcano plot of diGLY-containing peptides identified by TMT-MS3 with or without depolarization of iNeurons for 6h. diGLY-peptide abundance was normalized against total protein abundance when available (circle) or not (square). Filled colored circles/squares indicate statistically significant hits (Welch’s t-test (S0=1), corrected for multiple comparison by permutation-based FDR (1%)). diGLY-modified residue is indicated in bracket after the protein name. diGLY-peptide of proteins associated with mitochondria (MitoCarta 2.0 (Calvo et al., 2016) or mitochondrial outer membrane identified by proximity biotinylation (Hung et al., 2017)) are overlaid with an orange circle.
(B) Correlation plot of Log2(AO/UT) for WT iNeuron diGLY sites after depolarization for 2 (Y-axis) or 6 (X-axis) hours.
(C) Correlation plot of Log2(AO/UT) for diGLY sites from WT (Y-axis) or PARKINS65A (X-axis) iNeurons after depolarization for 6h.
(D) Distribution of changes in protein abundance (blue) or diGLY peptides (orange) for proteins that localize in individual organelles or protein complexes.
(E) Distribution of changes in protein abundance or diGLY peptides for proteins that localize in the mitochondria matrix, the MIM or the MOM.