
FIGURE 6. USP30 modestly restrains mitophagic flux and Ub phosphorylation with sub-threshold depolarization in iNeurons.
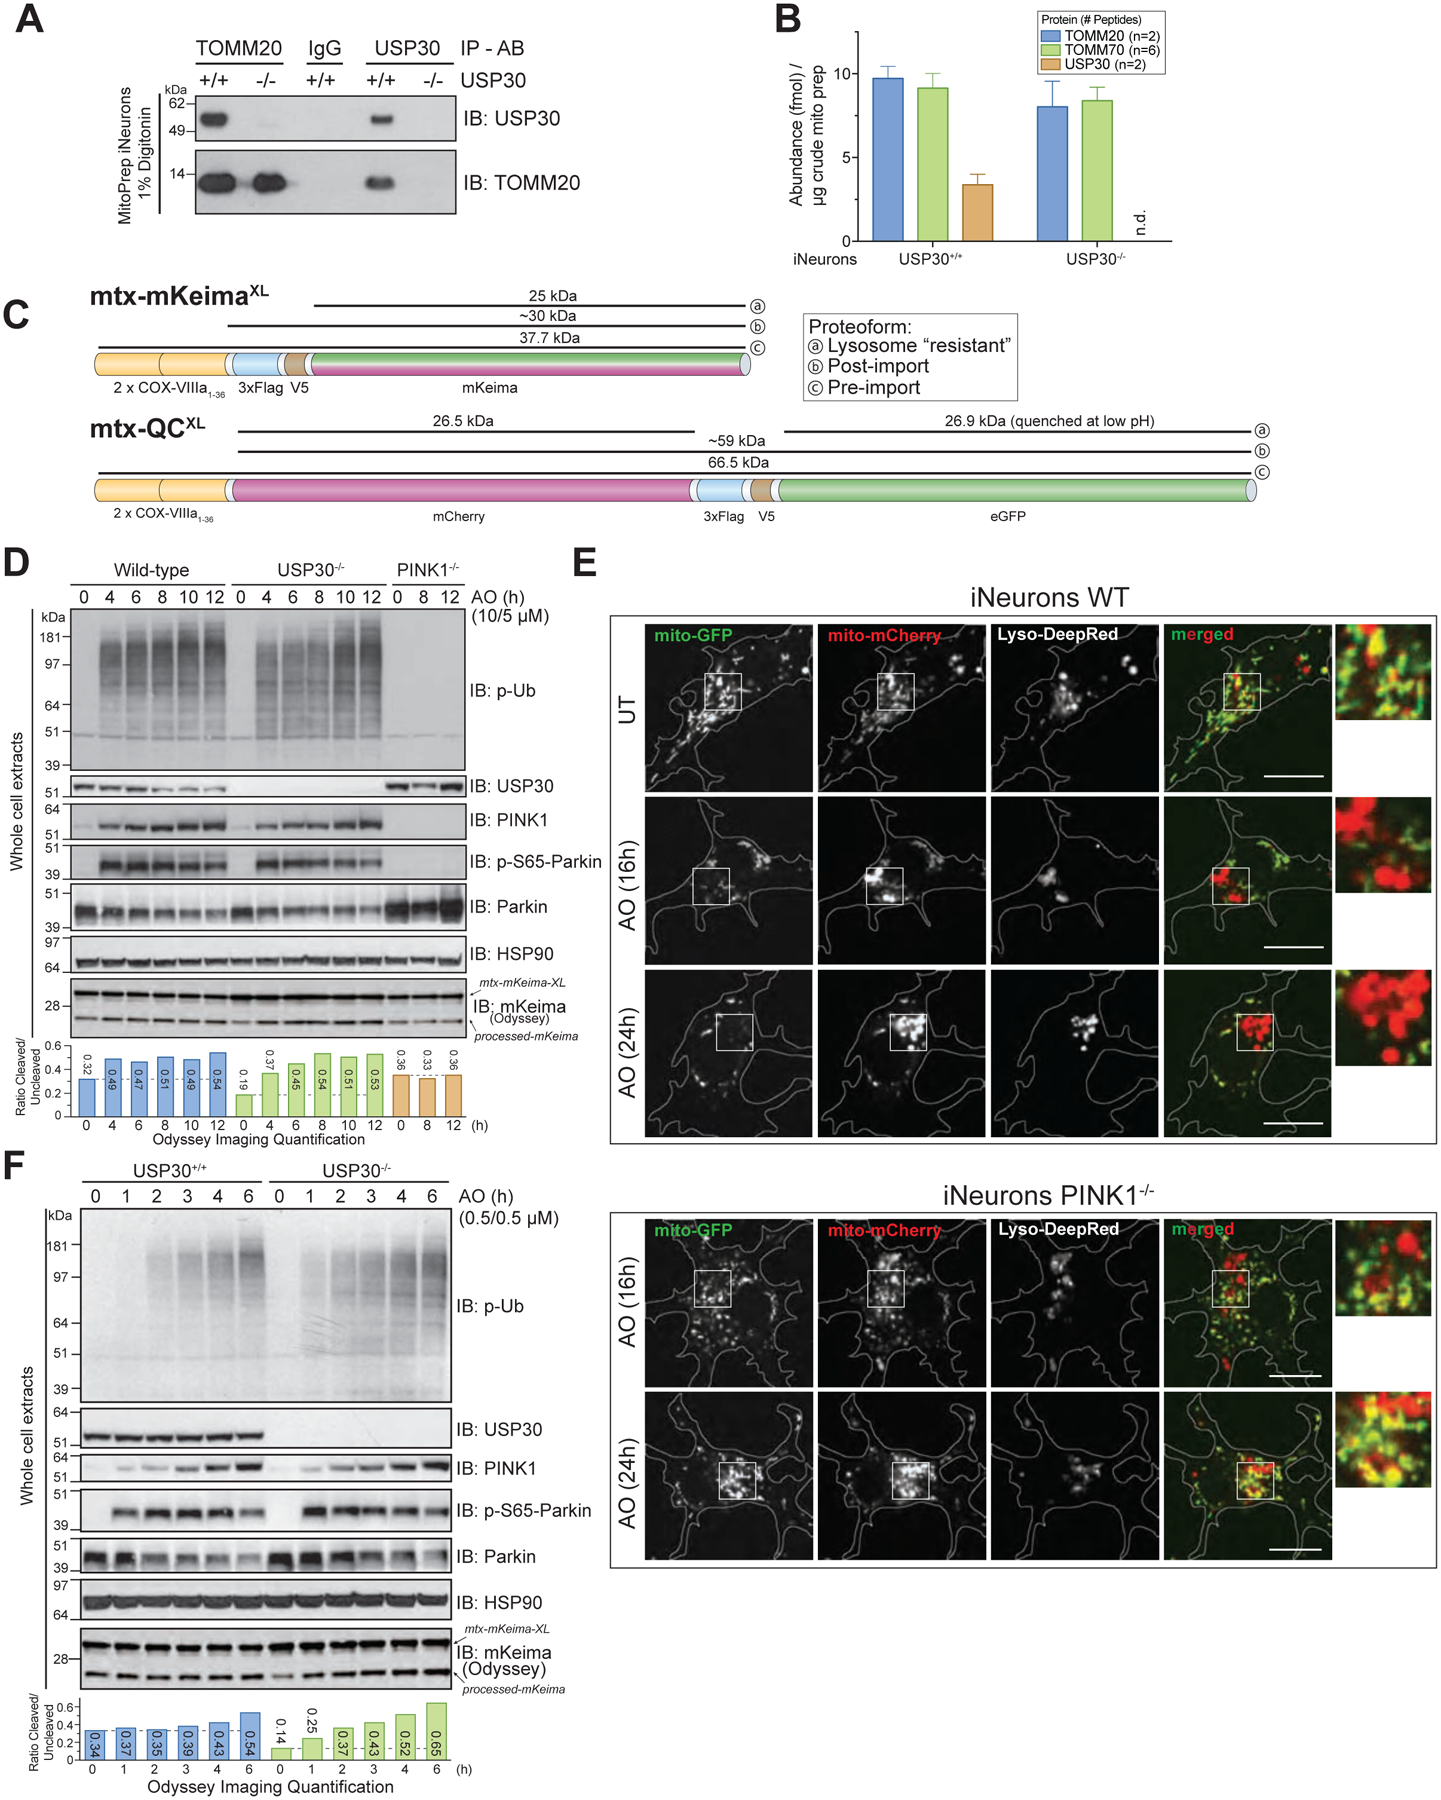
(A) USP30+/+ or USP30−/− iNeurons were lysed and extracts subjected to immunoprecipitation using α-TOMM20, α-USP30 or control α-IgG antibody prior to analysis by SDS-PAGE and immunoblotting.
(B) The absolute abundance of TOMM20, TOMM70, and USP30 in purified mitochondria was measured using Parallel Reaction Monitoring using 2, 6 and 2 heavy-reference tryptic peptides. The average number of fmol of each protein/μg of mitochondria are shown. Error bars represent SEM for peptide measurements.
(C) Schematic of the flux reporter constructs. mtx-KeimaXL contains dual mitochondrial targeting sequences from COXVIII, a FLAG-V5 epitope and the Keima protein. The sizes of full-length, post-import, and lysosomally processed (“resistant”) proteins are indicated. mtx-QCXL contains dual mitochondrial targeting sequences from COXVIII, mCherry, a FLAG-V5 epitope, and GFP. The size of the full-length protein as well as the products of cleavage in the lysosome are shown.
(D) The indicated iNeurons were depolarized with 10μM Antimycin A/5μM Oligomycin (overt depolarization) for the indicated times and cell extracts immunoblotted with the indicated antibodies. The relative ratios of processed to unprocessed Keima was measured using quantitative immunoblotting with Odyssey (see STAR METHODS).
(E) WT or PINK1−/− iNeurons expressing mtx-QCXL were depolarized as in panel F and imaged for mCherry, GFP, and Lysotracker Deep-Red at the indicated time points. Cells were imaged as described in STAR METHODS.
(F) The indicated iNeurons were depolarized with 0.5μM Antimycin A/0.5μM Oligomycin (sub-threshold depolarization) for the indicated times and cell extracts examined as in panel D.