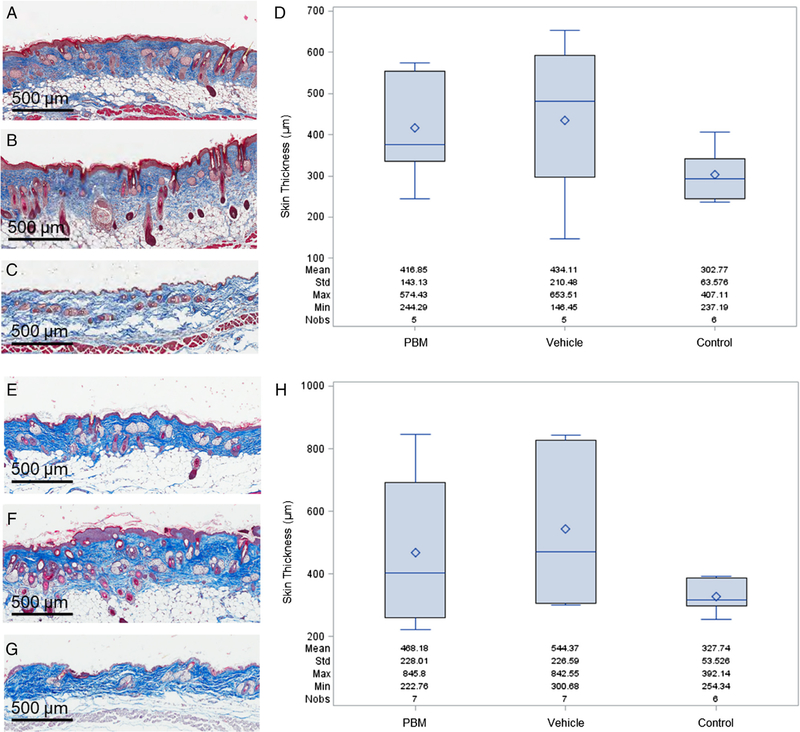
Figure 6.

Skin thickness measurements at 9 and 17 weeks postirradiation. The treated skin was harvested at each of these time points, Masson’s trichrome stain was performed, and measurements of skin thickness from the dermal-subcutaneous interface to the external surface of the epidermis were made to measure collagen deposition. Representative images of the 9 week time point are shown in (A) 35 Gy + treatment with plasma-based biomaterial (PBM), (B) 35 Gy + treatment with vehicle alone, (C) control skin without irradiation or treatment. A box plot of the results of the 9 week time point is shown in (D). Representative images of the 17 week time point include (E) 35 Gy + PBM treatment, (F) 35 Gy + vehicle alone, (G) control skin without irradiation or treatment. The box plot for the 17 week time point is shown in (H). The mean value is represented as ◊.
